Film Speed and Development Test (Excel spreadsheet supplied)

Your face (in it)

H
Your face (in it)

  • 0
  • 0
  • 7
A window to art

D
A window to art

  • 1
  • 0
  • 26
Bushland Stairway

Bushland Stairway

  • 4
  • 1
  • 77
Rouse st

A
Rouse st

  • 6
  • 3
  • 112

Recent Classifieds

Forum statistics

Threads
199,242
Messages
2,788,432
Members
99,841
Latest member
Neilnewby
Recent bookmarks
0

PeterB

Member
Joined
Apr 3, 2005
Messages
644
Location
Sydney, Aust
Format
Medium Format
So, I would like to try this test with my medium format film... However, my only controllable light source is my condenser enlarger. Is there a way to determine how long my exposure time (i.e., time the enlarger is switched on) for contact printing for a given enlarger height and lens aperture? I have a spot meter and a gray card, and for some reason that seems like all I should really need to determine a length of time for which to expose the film. But I'm clueless about how to determine a contact exposure time given a light meter's reading of f-stop and shutter speed.
Phil Davis details this in his book BTZS. This Google search will show you various peoples experiences with that.

I'm unsure if your light meter and grey card are sufficient. I think you need to use an integrating light meter or perform some preliminary tests, but I neither read nor performed the testing as described in BTZS so you'd best wait for replies from those who have used it or alternatively read through the search results I gave you.
 
Joined
Jan 7, 2005
Messages
2,634
Location
Los Angeles
Format
4x5 Format
Phil Davis has a really nice approach using an enlarger. I use a calibrated sensitiometer, so my approach is slightly different, but fundamentally they are the same. You need to determine much light is required to produce the required amount of exposure through a chosen step tablet density to produce a target density.

The speed equation is 0.8 / Hm (exposure in mcs at the point where the film has a density of 0.10 over Fb+f). For a 400 speed film, the aim exposure to produce a density of 0.10 over Fb+f is 0.8 / 400 or 0.0020 mcs. Generally you want to have this fall on the third or fourth step of the step tablet (0.15 step). The step tabet’s D-Max is 3.05 – 0.45 (3 steps) = 2.60 density. The equation to find Transmittance is:

Transmittance = Transmitted Light / Incident Light

Converting the equation to find Incident Light:

Incident Light = Transmitted / Transmittance

We already have the required transmitted light for a 400 speed film – 0.0020 mcs

Transmittance is the reciprocal of opacity or 1/ 10^density: 1/10^2.60 = 0.0025

0.002 / 0.0025 = 0.8 mcs


I like to use footcandles to measure incident light so for a shutter speed of 1/125 your will need:

(0.8 / 10.76) * 125 = 9.29 fc.

9.29 fc * 10.76 (convert to metercandles) * 1/125 (shutter speed) = 0.8 mcs

Transmitted light = Transmittance * Incident

.0025 * 0.8 = 0.0020

Equation for film speed 0.8 / Hm (mcs at 0.10 over Fb+f)

0.8 / 0.0020 = 400

For a 400 speed film exposing a step tablet with 9.29 footcandles for 1/125 second should produce a exposure through the 2.60 density step of 0.0020 producing a density of 0.10 over Fb+f.

You can use the reflected meter’s user manual to calculate how to determine footcandles or meter candles using the meter and a gray card.

I’m terrible with unit conversions, so I hope I got these right.
 
Last edited by a moderator:

PeterB

Member
Joined
Apr 3, 2005
Messages
644
Location
Sydney, Aust
Format
Medium Format
OK, after a bit more work with the spreadsheet, I have now shifted the relative placement of my curves up to simulate reducing the exposure (if you remember I had overexposed the stouffer step wedge thereby not getting into the toe region).
This shifting permitted me to create the toe for each curve. I already had two points in the toes on the curves, the FB+F and the density of one step from an X-Rite cal film having a Tx_density of 3.80.

Now having done this, I notice that I probably didn't develop for long enough. Given I was using Xtol 1+2, even though I extended out to nearly 32min@20degC, it looks like I needed to take it out to perhaps >50 minutes in order to get out to N+3 (avg. gradient =1.0) on the curves. Does that sound reasonable ? If so, then to save me exposing yet another film, can I assume that it is now OK for me to extrapolate my existing curve of Zone System [N] vs. development time[min] (bottom left of the 4 curves) out to say t=50minutes ?

One thing which makes me weary of doing this is that Ralph's example had him reaching N+3 and his corresponding curve is much more linear above N=0 rather than concave down (like mine). Now of course he used Tmax100 in ID-11 (I used HP5+ in tol 1+2) which could account for the different shapes, but I'm not familiar enough with the shapes to know if my shape is OK and whether I can extrapolate it or not.

My test summary:
Summary.png

Ralph's Test Summary:
Ralphs Summary.png

My Family of Curves:
Family of Curves.png

My spreadsheet:
View attachment FilmTestEvaluation #002b of Ilford HP5plus 120 in XTOL 1+2.xls
 
Joined
Jan 7, 2005
Messages
2,634
Location
Los Angeles
Format
4x5 Format
Peter,

There's nothing wrong with the shape of the Time/Gradient curve. The shape depends on the film/developer/methodology combination.

One of the advantages of plotting a Time/Gradient curve is that you can extrapolate data. One potential problem of attempting to extrapolate too much above the available data is there's no information about when the film hits gamma infinity.

Looking at your curve, I'm not sure if the film will make a gradient of 1.00.

Steve
 
Last edited by a moderator:

PeterB

Member
Joined
Apr 3, 2005
Messages
644
Location
Sydney, Aust
Format
Medium Format
Thanks Stephen.

I have done some research and the maximum contrast of HP5 plus (independent of the chosen dev or concentration or agitation etc) is about 0.9. [1]
This isn't a big problem for me as I don't live in England where the sun seldom shines and most of my plans for this film will be outside with high SBR, and worst case scenarios will certainly require no more than N+2 development.

Peter

[1] Roger Hicks: "I don't think that Ilford can get much above about 0.9 for gamma infinity on HP5, and that was in D19R, but equally, many films of the 30s could go well above 1. A figure I seem to remember is 1.3 to 1.5, but I can't verify that without effort. " link.
 
Joined
Jan 7, 2005
Messages
2,634
Location
Los Angeles
Format
4x5 Format
Peter,

I've attached a family of curves for HP5-P developed in Xtol. I have a feeling if you want to achieve the higher CIs, you're going to have to reduce the dilution.
 

Attachments

  • HP5 plus curve family.jpg
    HP5 plus curve family.jpg
    195.4 KB · Views: 169
  • HP5 plus curve family 120.jpg
    HP5 plus curve family 120.jpg
    193 KB · Views: 157

PeterB

Member
Joined
Apr 3, 2005
Messages
644
Location
Sydney, Aust
Format
Medium Format
Shutter out of calibration

Hi folks,

I had completed quite a few rolls of testing as per my earlier posts to this thread and I was becoming aware of a disturbing pattern. All of my shots were being over exposed ! Fortunately most of the test results were able to be shifted around to compensate for this, but it prompted me to measure the shutter speeds and compare them to the nominal values.

I was frustrated to find nearly all of them were 50-100% too slow. I made my own shutter speed tester by using an LED in reverse as a light sensor and connected it's output straight to an analog CRO. The persistence of the phosphor on the CRO screen together with my Android phone's video camera @25fps helped me to accurately measure the speeds.

Anyway, the moral of this post is to never assume your old analog shutter is reliable unless you or somebody else has tested it to be so !

I nearly sent it off for a Clean, Lube, Adjust and Test here on the other side of the world to me, until I discovered a reputable place right in my own backyard of Sydney (Legend Camera Services). They confirmed my measurements and also discovered the control spring had lost its tension and needed replacing.

Some time after it is returned and repaired I will finish documenting my film speed test results here.

rgds
Peter
 

PeterB

Member
Joined
Apr 3, 2005
Messages
644
Location
Sydney, Aust
Format
Medium Format
Is Ralph's effective film speed at 0.17 above B+F ?

Well, my lens/shutter has been mostly CLA'd (2 speeds are still out by 1/2 a stop), and I have now repeated the test to determine the film's ISO in my workflow.

I need help interpreting Ralph's instructions. In summary I need to know if he is suggesting to set the speed point at
  1. 0.17 absolute transmission density, or
  2. 0.17 above base+fog level.

My B+F=0.13, so if I use (1) then the ISO for my HP5+ seems unusually high at 635 , but if I use (2) then the ISO is a much more sensible 252.

Here are the instructions from Ralph's pdf above:
"A long but precise way to determine the normal EI requires one more roll of film and an additional test.....as explained in Way Beyond Monochrome, ....enter your normal EI into cell ‘L9’."​

then reading from p.139 in WBM, step 9.

"9. Using a densitometer, start with the first frame and twice the advertised film speed, count down 1/3 stop for every frame until you find the frame with the transmission density closest to 0.17 (Zone 1.5). The film speed used to expose this frame is your customized 'normal EI'"​
(I only reproduced step 9. to ensure Ralph still sells his book for those interested in the full test procedure :smile: )

Anyway to put the 0.17 into perspective, have a look at the following Figure 4 from the pdf Ralph attached above.
FilmTestEvaluation Figure 4 by Ralph Lambrecht.jpg

So far so good, as it appears to refer to using 0.17 above B+F (so in my case this equates to an abs density of 0.13+0.17=0.40 which is pretty high but gives an ISO of 252 by my testing).

There are however two points which conflict with 0.17 being a relative measurement above B+F.
  1. In the Figure 4 above, the RHS column shows Zone II beginning at 0.17 rather than Zone 1.5
  2. All the density measurements done thus far for the spreadsheet and entered into the "Input Data" tab (fig 3 in Ralph's pdf) are absolute values, but in point 9. above, there is no mention that 0.17 is a relative value in the instructions.

Can anybody explain why Zone II is beginning at 0.17 and reassure me that 0.17 is actually a relative density measurement ?

thanks
Peter
 

Bill Burk

Subscriber
Joined
Feb 9, 2010
Messages
9,330
Format
4x5 Format
The diagram clearly illustrates with two arrows (bottom arrow pointing up to B+F), the point selected is 0.17 above B+F.

With seven zones fitting in 1.2, each zone is 0.17 of density on film. Ralph positions Zone I so it is in the density range from B+F to 0.17.

Ralph may explain better but I think Zone I is "at" 0.09 and ranges from 0.00 to 0.17 thus Zone I 1/2 is conceptually the border between Zone I and II.
 
Last edited by a moderator:

Chuck_P

Subscriber
Joined
Feb 2, 2004
Messages
2,369
Location
Kentucky
Format
4x5 Format
Can anybody explain why Zone II is beginning at 0.17 and reassure me that 0.17 is actually a relative density measurement ?


This is Ralph's method of determining the speed point, the film speed rating that produces .17 negative density above fb+f and there's nothing wrong with that.

In the ZS as it is taught in The Negative , the speed point is determined by the film speed rating that produces a Zone I negative density of between .09 and .11. In past discussions, I know that Ralph does not consider a Zone I neg density value and thus a Zone I print value (i.e., the first suggestion of tonality, but containing no textural quality) to be of any "pictoral" value at all. Therefore, he dismisses it in his interpretation of the useful log exposure range. Again, nothing wrong with that------it's the same ZS principle, but IMO, with a different interpretation on establishing the speed point. I'm sure when Ralph sees this thread he will quickly set it straight if I have mispoke.
 
Last edited by a moderator:

PeterB

Member
Joined
Apr 3, 2005
Messages
644
Location
Sydney, Aust
Format
Medium Format
The diagram clearly illustrates with two arrows (bottom arrow pointing up to B+F), the point selected is 0.17 above B+F.
With seven zones fitting in 1.2, each zone is 0.17 of density on film. Ralph positions Zone I so it is in the density range from B+F to 0.17.
Ralph may explain better but I think Zone I is "at" 0.09 and ranges from 0.00 to 0.17 thus Zone I 1/2 is conceptually the border between Zone I and II.

Thank you Bill for reinforcing for me that 0.17 is indeed a relative measurement. I'll re-read WBM to see if Ralph's half zone nomenclature refers to the boundaries between zones while an integral zone number would refer to the mid point of a zone range. It does get confusing as I have always thought of each zone as a range rather than a discrete point, but the latter makes more sense.
 
Joined
Jan 7, 2005
Messages
2,634
Location
Los Angeles
Format
4x5 Format
Exposure placement is of importance. There's no question. Credit to anyone who wants to understand it better. My remark wasn't meant to disparage the questioning. My contention is that the question needs to be approached from a different conceptual direction in order to satisfactorily answer it or else things could remain in an endless round robin. Sorry, I don't have the time to go into details at the moment. Hopefully, later today.

If you want something in the mean time, there's a rather lengthy series of posts on the subject of expsoure in the thread "Is the K factor relevant to me or should I cancel it out?"

(there was a url link here which no longer exists)
 
Last edited by a moderator:

Bill Burk

Subscriber
Joined
Feb 9, 2010
Messages
9,330
Format
4x5 Format
Whether or not you zero out your densitometer on Base + Fog is significant but it is a very small discussion point.

I don't have a dogma about it, but I take a reading for Base+Fog then zero the densitometer on Base + Fog and read the rest of the numbers.
 
Joined
Jan 7, 2005
Messages
2,634
Location
Los Angeles
Format
4x5 Format
There are however two points which conflict with 0.17 being a relative measurement above B+F.

  1. In the Figure 4 above, the RHS column shows Zone II beginning at 0.17 rather than Zone 1.5
  2. All the density measurements done thus far for the spreadsheet and entered into the "Input Data" tab (fig 3 in Ralph's pdf) are absolute values, but in point 9. above, there is no mention that 0.17 is a relative value in the instructions.

Can anybody explain why Zone II is beginning at 0.17 and reassure me that 0.17 is actually a relative density measurement ?

It’s hard to figure out where to begin. There’s the concept of speed point and exposure placement and how they are two different things. There’s also the question of the accuracy of Zone System testing. But I’ll attempt to limit it to the question at hand.

Bill pretty much answered question 1. The range for a zone is from -1/2 to +1/2 of that Zone with the Zone number falling in the middle.

As for the second question, it’s all relative with the film curve because apart from using Zones as a guide between the original subject and the paper curve, Zones have little relevance when it comes to the film curve. There simply isn’t a fixed relationship between Zones and negative densities.

The scene has a luminance range and camera exposure places it on the film curve. The key is to place the scene’s values on a portion of the curve with a sufficient gradient to separate the tones on the print. Increasing or decreasing the exposure moves the entire illuminance range up or down the curve, but the luminance range of the scene remains the same.

In other words, the illuminance value that falls four stops under the metered exposure point is considered Zone I when shooting a 100 ISO film rated at 50 and it is also considered Zone I when shooting a 100 ISO film rated at 100. Using Ralph’s 0.17 as a speed point decreases the film’s EI as it relates to the 0.10 speed point by ½ to 2/3 of a stop depending on the curve shape and average gradient. This just shifts everything to the right 0.15 to 0.20 log-H units. The shadow falling four stops down from the metered exposure point doesn’t change from Zone I to Zone I ½ .

How it is illustrated in Ralph’s graph only works if you consider he is referencing how the change in exposure compares to using 0.10 as the speed point.

Figure 1 illustrates the relationship between the subject’s Zones and there placement on the film curve placing Zone I exposure at 0.10 over Fb+f.

Figure 2 illustrates the relationship between the subject’s Zones and there placement on the film curve placing Zone I exposure at 0.17 over Fb+f. It can also be considered simply increasing the camera exposure by 0.20 log-H units (2/3 stop).

Figures 1 and 2 represent the relationships in a non-flare environment such as during testing. Actual shooting conditions include flare.

Figure 3 illustrates how flare changes the relationship of the illuminance values with the subject luminance values. Everything is the same as with Figure 1 except for the addition of flare and an adjustment in the camera exposure in order to place the flare shadow exposure at 0.10 over Fb+f.

Figure 4 can be considered the type of results that are obtained using Zone System testing with 0.10 as the speed point. With ZS testing there is little flare. An exposure four stops down from the metered exposure point excluding flare will fall on 0.10 over Fb+b, but with the addition of flare that exposure produces a higher film density, but it is still considered a Zone I exposure. As flare varies from scene to scene, it is impossible to predict exactly where the shadow exposure will fall for a specific scene.

What makes Ralph’s example confusing is that he suggests decreasing the film’s EI to increase the exposure by approximately ½ stop, yet what he seems to be describing is a change in the scene’s luminance distribution. Figure 5 illustrates a change in the distribution of the luminance range from Zone I to Zone VIII to Zone I ½ to Zone VIII ½. While this will shift the exposure to the right on the film curve, the mechanism isn't the same as changing the EI.
 

Attachments

  • Zones and Exposure Placement 5.jpg
    Zones and Exposure Placement 5.jpg
    151 KB · Views: 102
  • Zones and Exposure Placement 4.jpg
    Zones and Exposure Placement 4.jpg
    148.5 KB · Views: 93
  • Zones and Exposure Placement 3.jpg
    Zones and Exposure Placement 3.jpg
    151 KB · Views: 104
  • Zones and Exposure Placement 2.jpg
    Zones and Exposure Placement 2.jpg
    146.4 KB · Views: 92
  • Zones and Exposure Placement.jpg
    Zones and Exposure Placement.jpg
    151.9 KB · Views: 103

Chuck_P

Subscriber
Joined
Feb 2, 2004
Messages
2,369
Location
Kentucky
Format
4x5 Format
For those that do not have a lot of other highly technical sources and refference material on hand, the concepts being addressed are found in The Negative. This text has often been criticized for representing "bubble gum" sensitometry, but if it was too overly technical, it would be criticized for that as well.

Bill pretty much answered question 1. The range for a zone is from -1/2 to +1/2 of that Zone with the Zone number falling in the middle.
Just chiming in that this is mentioned in The Negative on page 52, although not as in great detail, but it doesn't have to be either. It states that the individual gray values produced at each zone are the midpoint of their respective zone.
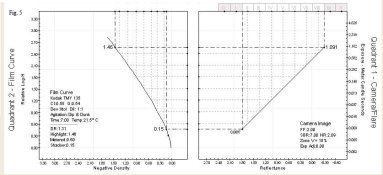
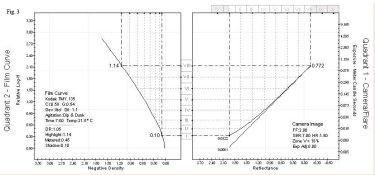
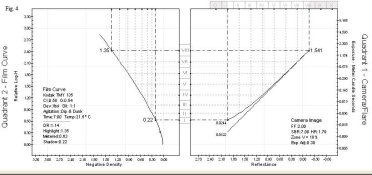
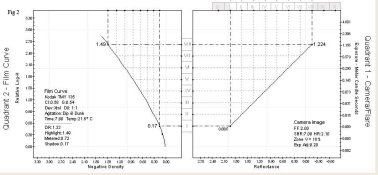
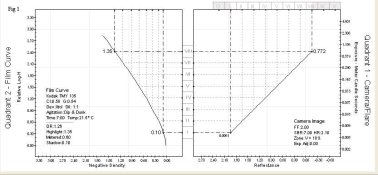
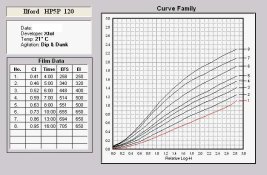
As for the second question, it’s all relative with the film curve because apart from using Zones as a guide between the original subject and the paper curve, Zones have little relevance when it comes to the film curve. There simply isn’t a fixed relationship between Zones and negative densities. The scene has a luminance range and camera exposure places it on the film curve. The key is to place the scene’s values on a portion of the curve with a sufficient gradient to separate the tones on the print. Increasing or decreasing the exposure moves the entire illuminance range up or down the curve, but the luminance range of the scene remains the same.

Not disagreeing, this is also covered in the book very adequately IMO and without any unnecessary verbage on page 67-69 in the discussion of "subject contrast", specifically regarding the short-scale low contrast subject. The Chapter on the ZS covers these things, IMO, in practical and understandable terms, but not without some personal indeavor to "see" it. Regardless of how this stuff is discussed, either in a more simpler or complicated manner, it will never, IMO, be immediately obvious.

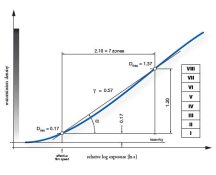
It clearly covers, IMO in the ZS chapter, that a subject luminance ratio, for example, of 8:1 remains 8:1 between any 4 zones on the log exposure scale, be it between Zone III and Zone VI or between Zone IV and Zone VII, between Zone V and Zone VIII, etc....
 
Joined
Jan 7, 2005
Messages
2,634
Location
Los Angeles
Format
4x5 Format
Maybe these two examples will help clear up my point. The four quadrant curve should illustrate the difference between changes in exposure and changes in luminance. The second example is an adjustment to Ralph's illustration.
 

Attachments

  • Exposure and Luminance.jpg
    Exposure and Luminance.jpg
    274.4 KB · Views: 104
  • Ralphs Adjusted Example.jpg
    Ralphs Adjusted Example.jpg
    71.9 KB · Views: 103

PeterB

Member
Joined
Apr 3, 2005
Messages
644
Location
Sydney, Aust
Format
Medium Format
I will finish documenting my film speed test results here.
I wanted to share my latest version of the film testing spreadsheet. In summary I have made changes to permit the user to adjust their target density range. Ralph had defaulted it to 1.20 in many places (as he targets grade 2 paper in a diffusion enlarger). But because others will use condenser enlargers etc, I wanted to share my changes.
I replaced all instances of the 1.20 constant with a user adjustable value on the first worksheet (Input Data, cell K66). The value I adjusted mine to was 1.05 because I have a condenser enlarger (which would usually take it down to 0.9 as a starting point), but my camera system is susceptible to a reasonable amount of flare so I increased it by 0.15 to 1.05.

View attachment FilmTestEvaluation #003 of Ilford HP5plus 120 in XTOL 1+2.xls


Now it is rather late in my evening and I want to get clarification on a major concept. On p. 7 of Ralph's PDF instructions in this thread (also in WBM p. 139), Ralph plots the Effective Film Speed versus Zone System N. I'm embedding the one I've come up with.
Effective Film Speed vs Zone System N.jpg

My normal (N=0) EI turns out to be 252 (no surprise there as it is 2/3 of a stop below the nominal 400). Hence for an N=0 scene with SBR=7, I would set my light meter to ISO 250, meter a Zone III part of the scene and expose accordingly.

Now, if I photograph a scene that is say N+2 (i.e. with a SBR=5), do still have my light meter set to ISO 250 or do I set it to the value of 650 shown in the above graph ? I'm pretty sure I leave it at 250 and I know I could answer this question myself by thinking about it and doing more reading, but right now it is late and it is quicker for me to type these 2 paragraphs and get a quick answer from the experts. Soon all this will be 2nd nature to me, but right now I am taking it one step at a time. BTW if you do happen to answer, please don't feel obliged to give a really long explanation. Just a simple yes or no will be plenty !
 

PeterB

Member
Joined
Apr 3, 2005
Messages
644
Location
Sydney, Aust
Format
Medium Format
If you feel your testing method is accurate, then you adjust the EI; however, it's not an absolute requirement.

Thanks Stephen. I had forgotten that the shadow transmission (Tx) density increased with increasing film dev time. I should have remembered this last night when I posted, but my brain was shutting down as it was late.
The highlight Tx density on the neg increases much more (with increasing film dev time), the shadow Tx density does still increase to a lesser extent and this is catered for by giving less exposure by increasing the effective film speed. This is obvious to me now since the Family of Curves worksheet clearly show each toe region being higher in Tx density than the last as the film dev time is increased. Ralph points this out at the end of p. 139 in WBM (and prob. in many other places in WBM too).

I'm happy that my test method is sufficiently accurate for my initial attempts. Assuming I didn't make any unintentional errors then the only thing I would change if I retested would be to reduce my exposure times to get more of the toe in for each of the 5 films. I did get one point on 4/5 of the toes, the last one I guessed to match the obvious pattern that emerged. Full details specific to my testing efforts are in the spreadsheet I attached in my last post.

rgds
Peter
 

Chuck_P

Subscriber
Joined
Feb 2, 2004
Messages
2,369
Location
Kentucky
Format
4x5 Format
Been looking at the spread sheet, the 21st or 31st step is shown as being the chemical fog density, but these are defined steps and clearly, at least from my tests, contain density both from exposure and chemical fog. It's just an observation. I use a piece of black electrical tape in the middle between the rows of step densities to ensure there is an adequate section of the tablet that does not receive exposure from which to read just chemical fog density, but that's just me.
 

PeterB

Member
Joined
Apr 3, 2005
Messages
644
Location
Sydney, Aust
Format
Medium Format
Been looking at the spread sheet, the 21st or 31st step is shown as being the chemical fog density, but these are defined steps and clearly, at least from my tests, contain density both from exposure and chemical fog.

This will depend on how much exposure you give the step tablet. Ideally one wants at least step 31 to be in the Base+Fog. In my case I had applied too much exposure and I got none of the 31 steps close enough to the B+F. I got plenty of film shoulder but little or no toe. I had to discard the shoulder points as they are of no use in this particular test. I did get one significant point in the toes of 4/5 of the films using an X-rite four step cal tablet whose darkest density is 3.80 . I used that tablet along with Stouffer 31-step. The darkest step(#31) on the Stouffer 'only' had a density of 3.05.

Anyway my point is that in my testing, step #31 certainly produced a density much higher than the base+fog level on each film. B+F was 0.11 to 0.15 for my 5 films (increasing with increasing dev time). The neg Tx densities for step 31 were 0.29 (G23), 0.19 (H29), 0.24 (I29), 0.31 (J29) and 0.37 (K29). The first value (0.29) seems too high, but I used a longer shutter speed on that film compared to the other 4 (using 2 shutter speeds introduced another complication as the mechanically timed shutter speeds aren't exactly integer multiples of each other, but I did measure their exact speeds separately).

The other thing you may find confusing on my Input Data worksheet is that those 5 points above do not line up with row 41 (being step#31). this was because I shifted the relative placement of my curves up to simulate a reduction in exposure because I over exposed the steps. See posts (there was a url link here which no longer exists) and (there was a url link here which no longer exists) from me above which detail this a bit more.

It's just an observation. I use a piece of black electrical tape in the middle between the rows of step densities to ensure there is an adequate section of the tablet that does not receive exposure from which to read just chemical fog density

Make sure your tape lets negligible light through. I just measured the Tx density of piece of black PVC electrical tape and it was at least 5.0 which should be fine. Mentioning that reminds me of how for too long I used pieces of unexposed, fixed and washed MG IV RC paper for a dodging/burning mask. The paper would let through a small amount of light and sometimes just subtly flatten the areas under the paper.


regards
Peter
 
Photrio.com contains affiliate links to products. We may receive a commission for purchases made through these links.
To read our full affiliate disclosure statement please click Here.

PHOTRIO PARTNERS EQUALLY FUNDING OUR COMMUNITY:


Ilford ADOX Freestyle Photographic Stearman Press Weldon Color Lab Blue Moon Camera & Machine
Top Bottom