After posting my comment #76, I thought maybe you had measured B+F outside the step wedge, in an area totally not exposed (which is the correct way). Or, as suggested by ic-racer in post #78, "
Perhaps it is the graphing software, not showing the whole dataset."
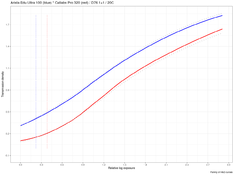
But the numbers that you state above (blue text) show that you just take as B+F the lowest exposure point in the step wedge. Most obvious is "
The Arista film's B+F is 0.3" (blue curve). I find it hard to believe that the blue curve, if measured further to the left, would not reach a density level of 0.2.
Can you please, if you have not already done so, measure B+F in a film area that was totally un-exposed?
If true, that would mean that the Arista film's speed point is further to the left, i.e. its speed is higher; and, even if the absolute photometric calibration is not correct, that would also mean that the Catlab film is even slower relative to a "ISO100" film.
This said:
- Leave aside 1/3 stop quibbles; in b/w that is completely insignificant; in actual use much below the inevitable differences between pointing your meter a little more to the right or to the left.
- The test by oldwino https://www.photrio.com/forum/threa...film-320-pro-2022-version.194630/post-2599132 tends to show rather convincingly that 320 is not an unreasonable speed for that film. Could the long toe explain this apparent contradiction?
View attachment 319213
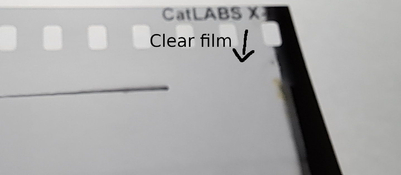
Thanks for your questions! It's great to have them, they bring more detail into the thread. Let me see if I can answer your questions. Yes, the entire data set is plotted here. And, yes, I always measure B+F on a clear part of the film. My "sensitometer" has a piece of opaque plastic off to the side of the step tablet to make sure it is not exposed. See the image below, clear film patch marked with an arrow.

The Arista film, as I mentioned earlier, has a very high B+F, of about 0.31 - 0.32, subject to the error of my sensitometer. So, the toe is very short. The first step of the step tablet does not reach B+F by approximately 0.01, which I ignored because its within the margin of error. Simply put, the Arista film received too much exposure to produce a well-formed toe. However, the Arista is only meant to provide a point of reference for the Catlabs film exposure. That was the whole point, namely, to establish the "right" amount of exposure for the Catlabs film and to compare it another popular film, which I'd tested before and whose performance I am familiar with. I concluded from this initial test, that I need to reduce exposure by about 1/2-2/3 stop to get a long enough toe for precise analysis.
And, yes, you are correct, the Catlabs Pro 320 does, indeed appear slower than the Arista Edu Ultra 100 by about 1/2 stop.
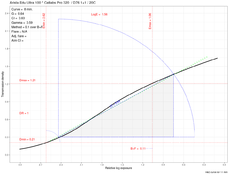
This may have gotten lost in this thread, but I ran the original test using a calibrated and certified sensitometer, giving the Catlabs film the "correct" amount of exposure for an ISO 200-320 film. I ran that full test twice, and spot-tested the film the third time, to be sure. I also compared those results to Neopan 400 and 400TX. The Catlabs film turned out to be much slower than either. You are absolutely correct that the long toe makes curve analysis very difficult and somewhat unreliable. However, I could not use my sensitometer to test the film further, as it does not allow for the change in illumination levels, only in duration. I would have to expose the Catlabs film for a calculated exposure of 2-3 seconds. Without knowing reciprocity data from the manufacturer, that would have been futile.So I constructed a DIY sensitometer to give the film a lot more exposure, this time for the shutter duration of 0.25 sec., so there's no contribution from reciprocity failure. The curve you're referring to, was obtained with that DIY device. I am including a more detailed plot of the Catlabs curve, so you can see more easily some of the important parameters.

How do I explain the apparent discrepancy between my results and those of others? I can't without running the full test yet again, this time, with the "correct" amount of exposure, such that we get a well-formed curve family. I am currently working on that, but it will take me at least a week or two to complete. I might also try to do a rudimentary spectral response analysis.
To sum up, in my tests, the Catlabs Pro 320 is consistently slower than both Kodak 400TX and Arista Edu Ultra 100. Once my test has been concluded, I will make available a full report, including multiple methods of measuring film speed and the raw data, so that anyone here can run their own analysis, with their own tools. Then, and only then, could we reach any sort of conclusion as to what the Catlab Pro 320 film speed is, what its performance is, in general, and response to development time, in particular.


 , plus one can always learn something new from forum members.