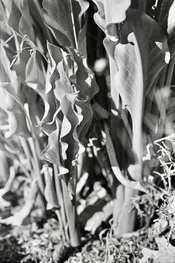
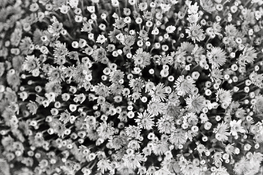
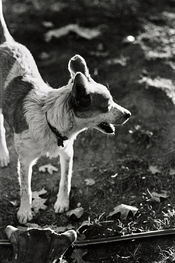
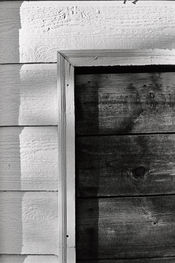
Testing and evaluating CatLabs "X Film 320 Pro (2022 version)

CAMDEN LOCK

A
CAMDEN LOCK

  • 0
  • 0
  • 6
Canal Boat

A
Canal Boat

  • 0
  • 0
  • 8
solarized farmhouse.jpg

A
solarized farmhouse.jpg

  • 0
  • 0
  • 10
Red Telephone Boxes

A
Red Telephone Boxes

  • 0
  • 0
  • 9

Recent Classifieds

Forum statistics

Threads
183,153
Messages
2,539,362
Members
95,750
Latest member
cyoder
Recent bookmarks
1

Oldwino

Subscriber
Joined
Jun 6, 2014
Messages
481
Location
California
Format
Multi Format
I’ve run a bracketed set of exposures, from +3 to -2, based on the “box speed” of 320. I used the CatLabs recommended time for Rodinal 1+25. Incident metering.

The film is drying, but my initial impression is that within these parameters, my EI is around 400.

I‘ll post some pics of the negs later.
 

Tomro

Member
Joined
Apr 1, 2022
Messages
64
Location
Italy
Format
Medium Format
I’ve run a bracketed set of exposures, from +3 to -2, based on the “box speed” of 320. I used the CatLabs recommended time for Rodinal 1+25. Incident metering.

The film is drying, but my initial impression is that within these parameters, my EI is around 400.

I‘ll post some pics of the negs later.

35mm and metering in camera?
 
OP
OP
aparat

aparat

Subscriber
Joined
Sep 5, 2007
Messages
1,124
Location
Saint Paul,
Format
35mm
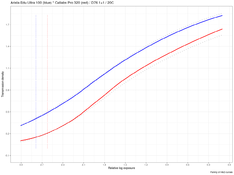
I did a bit more work on the comparison between Arista Edu Ultra 100 and Catlabs Pro 320 last night and, it turns out, I had been a bit off with my preliminary findings. I ended up having to adjust each curve to give it the average gradient of 0.62, per the ISO speed point procedure (described in a lot of sources, incl. Davis, 1993). This type of adjustment provides a simulation of how these curves would look if they were processed to precisely the same G. It's necessary to do that, I think, as it's very difficult to get the same G for two different films, even with the strictest of exposure and processing controls. In the image attached here, the dotted lines represent these "ideal" ISO curves. Speed points measured from these curves are marked with the vertical dotted lines (blue - Arista, red - Catlabs). The difference is film speed measured this way is about 0.549415 stops if favor of the Arista film, so less than I originally estimated in my preliminary analysis. I am sorry about that. I should be more careful next time. So, after these corrections, the film speed I am getting are ISO 85.15897 for Arista, and ISO 58.26475 for the Catlabs film.

Those of you who looked at my previous analysis of film curves, noticed that the ISO values obtained there were a bit lower. The film simply received significantly less exposure than it needed to produce well-formed curves. It has been found in the literature that curves with long toes are particularly difficult to analyze and are susceptible to film speed estimate errors by the ISO 0.1 criterion. (e.g., Nelson and Simonds, 1955). That amount of exposure, by the way, was perfectly suitable for other medium-speed films,
such as Kodak 400TX and Fujifilm Neopan 400. aue100_catlabs320_comparison.png

Again, in my opinion, the actual ISO value does not matter much, as most photographers come up with their own personal EI value, anyway. We all have different cameras, different exposure meters, different techniques, different processing, digitization, printing, etc. To be clear, I am absolutely not disputing the fact that some photographers are getting excellent (for them) results exposing at EI 200. What I think is more important is that, under controlled conditions, the Catlabs film does, indeed, appear slower than other popular films, such as Kodak 400TX and Arista Edu Ultra 100 (most people agree it's Foma 100).

It would be great if other photographers were able to produce data of their own, regardless of how they were obtained. I really liked the idea of using the methods described @pentaxuser and @BradS earlier in the thread. I think the "Fred Picker" method would be interesting, as well. There's a great method described in Way Beyond Monochrome (Lambrecht and Woodhouse , 2011).
 
OP
OP
aparat

aparat

Subscriber
Joined
Sep 5, 2007
Messages
1,124
Location
Saint Paul,
Format
35mm
Could you please provide a bit more details how your sensitometer works? Do you have a calibrated step-wedge that you put in front of the film as is done in commercial sensitometers? Or do you have a slide that covers parts of your film as your make multiple exposures (similar to how you would do exposure tests strips for printing)?
Please continue your experiments. I have little interest in Catlabs' films but your tests and methodology are fascinating!
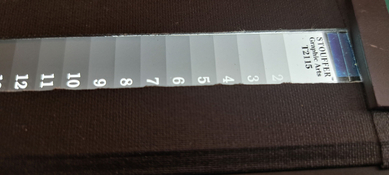
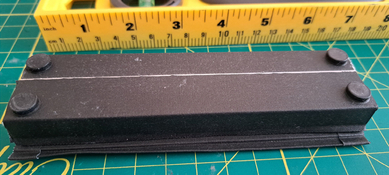
My sensitometer is very simple. It is not calibrated. It is entirely DIY. I used a piece of aluminum that is 6 x 1.5 x 0.5" and attached a piece of 1/8 inch thick glass with a soft, fabric hinge. I am using an uncalibrated Stouffer step tablet, as you can see in the picture attached here. I use an on-easel light meter to estimate the amount of illumination, and I am using a shutter installed in place of the enlarger lens (for 0.25 sec. to avoid potential reciprocity complications). I expose a piece of film about six inches long, one at a time, through the step tablet. It is essentially a contact print. Then I transfer the exposed strips of film to a lightproof box. I then process the film normally, dry it, and then read the densities with a densitometer. I then enter the numbers into a program I wrote to run the analysis. It's not a perfect system by any means, but I think it can get one at least a ballpark estimate of a film's performance.
steptablet.jpeg
bottom_part.jpeg
 

Oldwino

Subscriber
Joined
Jun 6, 2014
Messages
481
Location
California
Format
Multi Format
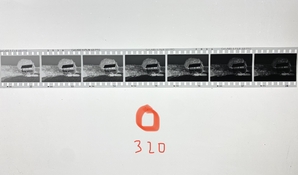
Here's the set. Three stops either side of the "0", or 320 ISO on my Sekonic meter. Somewhere between 320 and 640 for these would be pretty nice. 200/160 is a little crispy.

IMG_1925.jpeg
 

BradS

Member
Joined
Sep 28, 2004
Messages
7,656
Location
Sonora, California
Format
35mm
Here's the set. Three stops either side of the "0", or 320 ISO on my Sekonic meter. Somewhere between 320 and 640 for these would be pretty nice. 200/160 is a little crispy.

View attachment 319027

Good work! Thanks!
This is an interesting result. Just to make sure I understand, We're looking at, left to right, -3, -2, -1, 0, +1, +2, +3 stops of exposure compensation...or in other words, ASA 2560, 1280, 640, 320, 160, 80, 40...yes?

Seems like the the DX encoded speed, ASA1250 would produce printable negative, if a little thin.
and ASA 80 looks a little dense for my taste.
 

BradS

Member
Joined
Sep 28, 2004
Messages
7,656
Location
Sonora, California
Format
35mm
I did a bit more work on the comparison between Arista Edu Ultra 100 and Catlabs Pro 320 last night and, it turns out, I had been a bit off with my preliminary findings. I ended up having to adjust each curve to give it the average gradient of 0.62, per the ISO speed point procedure (described in a lot of sources, incl. Davis, 1993). This type of adjustment provides a simulation of how these curves would look if they were processed to precisely the same G. It's necessary to do that, I think, as it's very difficult to get the same G for two different films, even with the strictest of exposure and processing controls. In the image attached here, the dotted lines represent these "ideal" ISO curves. Speed points measured from these curves are marked with the vertical dotted lines (blue - Arista, red - Catlabs). The difference is film speed measured this way is about 0.549415 stops if favor of the Arista film, so less than I originally estimated in my preliminary analysis. I am sorry about that. I should be more careful next time. So, after these corrections, the film speed I am getting are ISO 85.15897 for Arista, and ISO 58.26475 for the Catlabs film.

Those of you who looked at my previous analysis of film curves, noticed that the ISO values obtained there were a bit lower. The film simply received significantly less exposure than it needed to produce well-formed curves. It has been found in the literature that curves with long toes are particularly difficult to analyze and are susceptible to film speed estimate errors by the ISO 0.1 criterion. (e.g., Nelson and Simonds, 1955). That amount of exposure, by the way, was perfectly suitable for other medium-speed films,
such as Kodak 400TX and Fujifilm Neopan 400. View attachment 319007

Again, in my opinion, the actual ISO value does not matter much, as most photographers come up with their own personal EI value, anyway. We all have different cameras, different exposure meters, different techniques, different processing, digitization, printing, etc. To be clear, I am absolutely not disputing the fact that some photographers are getting excellent (for them) results exposing at EI 200. What I think is more important is that, under controlled conditions, the Catlabs film does, indeed, appear slower than other popular films, such as Kodak 400TX and Arista Edu Ultra 100 (most people agree it's Foma 100).

It would be great if other photographers were able to produce data of their own, regardless of how they were obtained. I really liked the idea of using the methods described @pentaxuser and @BradS earlier in the thread. I think the "Fred Picker" method would be interesting, as well. There's a great method described in Way Beyond Monochrome (Lambrecht and Woodhouse , 2011).

Thank you for all of your excellent work and these detailed explanations of equipment, process and procedure.
I'm having a little trouble interpreting the curves here. In particular, they seem...straighter, less curvy than expected. Is that because were only seeing ~10 stops of exposure along the horizontal axis - where we usually see ~14 (see for example, Ilford data sheets)? Or is it because the exposure given is...as you say, enough for ASA400 film...effectively getting up off the toe?...or, some combination of both of these? Also, is the vertical scale (effectively) logarithmic? That is, you've taken the base 10 log of the quantity and plotted that on a linear scale...yes? Is that also what Ilford does? (They're reticent about their equipment, process and procedure).
Thanks again for all of your work and contributions here.
 

brbo

Member
Joined
Dec 28, 2011
Messages
864
Location
EU
Format
Multi Format
Rightmost two start to get some definition in deep shadows, but are massively overdeveloped at that point.

This film looks worse and worse with every post.
 

Oldwino

Subscriber
Joined
Jun 6, 2014
Messages
481
Location
California
Format
Multi Format
Good work! Thanks!
This is an interesting result. Just to make sure I understand, We're looking at, left to right, -3, -2, -1, 0, +1, +2, +3 stops of exposure compensation...or in other words, ASA 2560, 1280, 640, 320, 160, 80, 40...yes?

Seems like the the DX encoded speed, ASA1250 would produce printable negative, if a little thin.
and ASA 80 looks a little dense for my taste.
Yes, that is correct.
 

Oldwino

Subscriber
Joined
Jun 6, 2014
Messages
481
Location
California
Format
Multi Format
Rightmost two start to get some definition in deep shadows, but are massively overdeveloped at that point.

This film looks worse and worse with every post.

It is a contrasty film, no doubt. There may be better developers for it, but I do think it is simply a higher contrast film.
I also think that the recommended developing times, at least for Rodinal, are too long. I am thinking of trying shooting the next roll at 320, and dropping 10% or so from the dev time.

Looking at some scans, the film has good sharpness and nice grain.The look it can give - deep shadows and a certain "crispness" - is modern and very popular with folks who shoot a lot of digital. It is not a long-tone film. It is not a do-it-all film. It is something different, which is kind of nice. Not everything has to be the same.
 

Oldwino

Subscriber
Joined
Jun 6, 2014
Messages
481
Location
California
Format
Multi Format
These are all shot at 200, processed in Rodinal 1+25 at the CatLabs recommended time (which I think is a touch too much). But, it is workable, and the film is sharp and has nice grain. It has its own look, for sure.

R2022-10-14-0006_ID.jpg

R2022-10-14-0007_ID.jpg
 

pentaxuser

Subscriber
Joined
May 9, 2005
Messages
17,089
Location
Daventry, No
Format
35mm
Rightmost two start to get some definition in deep shadows, but are massively overdeveloped at that point.

This film looks worse and worse with every post.

What does this mean for you in terms of film speed? I still have difficulty in interpreting negatives but based on these it looks to me as if 160 or possible 80 might be the best two negatives in terms of printing from an enlarger

Yes the second stage of fitting your film to a developer is to get the development time right after deciding on its speed

pentaxuser
 

Alex Benjamin

Subscriber
Joined
Aug 8, 2018
Messages
897
Location
Montreal
Format
Multi Format
Posted some of my picks in the other thread.
 

Romanko

Member
Joined
Sep 3, 2021
Messages
142
Location
Sydney, Australia
Format
Medium Format
My sensitometer is very simple. It is not calibrated. It is entirely DIY.
Thank you for this information. Great idea to use a shutter! Your system is as good as any commercial sensitometer and probably as accurate. Your main uncertainty would come from the exposure measurements (light meter and shutter combined). With good light meter and shutter you should be within 1/3 of a stop, more than adequate for your tests.
 
OP
OP
aparat

aparat

Subscriber
Joined
Sep 5, 2007
Messages
1,124
Location
Saint Paul,
Format
35mm
Thank you for all of your excellent work and these detailed explanations of equipment, process and procedure.
I'm having a little trouble interpreting the curves here. In particular, they seem...straighter, less curvy than expected. Is that because were only seeing ~10 stops of exposure along the horizontal axis - where we usually see ~14 (see for example, Ilford data sheets)? Or is it because the exposure given is...as you say, enough for ASA400 film...effectively getting up off the toe?...or, some combination of both of these? Also, is the vertical scale (effectively) logarithmic? That is, you've taken the base 10 log of the quantity and plotted that on a linear scale...yes? Is that also what Ilford does? (They're reticent about their equipment, process and procedure).
Thanks again for all of your work and contributions here.

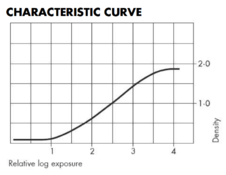
You're welcome! I hope I can answer your questions well. The curves look a little less "curvy" than the Ilford curves in the picture below (I hope I am not violating copyright by including it) because mostly of the reasons you mentioned. First, it's the toe. In this particular test, I wanted to see what the Catlabs Pro 320 curve would look like given a lot of exposure, so the toe is not as long as it is in the Ilford plot. Giving the "right" amount of exposure for a film test is a topic where opinions vary. I think (and others can correct me) that, ideally, we need up to about stop of just B+F. That is to illustrate the relationship between important curve parameters related to film speed, such as the 0.1 B+F criterion, the 0.3Ḡ criterion, Delta X criterion, and others. A well-formed toe is also important in modeling the curve such that it's possible to get a precise measure of the straight line portion of the curve, such Ḡ, Gamma, and Contrast Index, and others. So, when I run the next test, I am going to give the film a touch less exposure to get a more "clearly" defined toe. Thank you for that question. I should have clarified it earlier.

Finally, You are right that Ilford gives a broader range of exposure, probably so we could see how the shoulder is formed, i.e., the compression of the curve where the linear relationship between exposure and density changes and the film finally reaches its maximum density. Some film and development combinations can achieve a shoulder within the ten-stop exposure range. Here, FP4+ seems to need a bit extra. The rest is due to "cosmetics" of the aspect ratio of the plot image itself. Both exposure and density scales are logarithmic. That seems to be the convention in the literature. The Ilford "Relative log exposure" shows a progression from 0 to 4, whereas I chose the reversed axis convention. I can change it in my software from one to the other. I've seen it done either way in the literature.
Screenshot from 2022-10-14 20-06-41.png
 
OP
OP
aparat

aparat

Subscriber
Joined
Sep 5, 2007
Messages
1,124
Location
Saint Paul,
Format
35mm
How can anyone take these results seriously? They have pathetically few significant digits. At least a dozen are necessary. :smile:

Yeah. Old habits die hard :smile:. I just copied and pasted from my program without rounding. Sorry about that!
 
OP
OP
aparat

aparat

Subscriber
Joined
Sep 5, 2007
Messages
1,124
Location
Saint Paul,
Format
35mm
Here's the set. Three stops either side of the "0", or 320 ISO on my Sekonic meter. Somewhere between 320 and 640 for these would be pretty nice. 200/160 is a little crispy.

View attachment 319027

This is a very interesting progression. Thank you for including it! It seems Rodinal 1+25 time, temperature, and agitation provided by the manufacturer work out perfectly for you. I wonder whether the 1+50 of 19 minutes gives the same contrast. Have you tried 1+50, by any chance? Also, I cannot tell from this picture, but is this a scan or a photo on a light table?
 
Last edited:

markjwyatt

Subscriber
Joined
Apr 26, 2018
Messages
2,191
Location
Southern California
Format
Multi Format

albada

Subscriber
Joined
Apr 10, 2008
Messages
1,855
Location
Escondido, C
Format
35mm RF
I can change it in my software from one to the other. I've seen it done either way in the literature.

Could you post your software to a new thread? Some of us would appreciate being able to compute ISO, CI, etc., from densitometer measurements. I hope the software is written in a popular language with free compilers/interpreters such as Python, C, C++, or even Fortran.
 

Romanko

Member
Joined
Sep 3, 2021
Messages
142
Location
Sydney, Australia
Format
Medium Format
The Ilford "Relative log exposure" shows a progression from 0 to 4, whereas I chose the reversed axis convention.
I find Ilford "Relative log exposure" more intuitive as more exposure results in higher negative density. Kodak, Foma and many other film manufacturers use this convention.
 
Photrio.com contains affiliate links to products. We may receive a commission for purchases made through these links.
To read our full affiliate disclosure statement please click Here.

PHOTRIO PARTNERS EQUALLY FUNDING OUR COMMUNITY:


Ilford ADOX Freestyle Photographic Stearman Press Weldon Color Lab Blue Moon Camera & Machine
Top Bottom