Applied Photographic Theory by Paul Kowaliski, Chapter 1 Tone Reproduction,
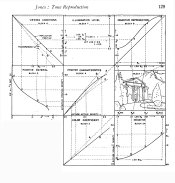
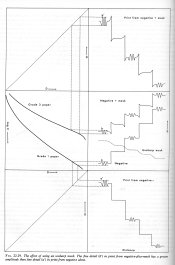
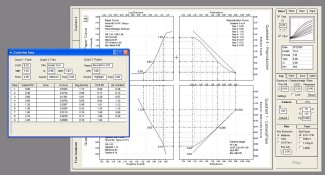
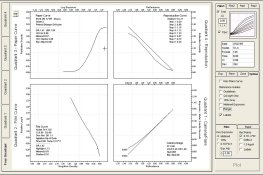
"The graphical method invented by Jones, already mentioned in several instances, allows a determination of objective and subjective tone reproduction with full consideration of all the empirical relationships between the various parameters described in the preceding chapters (see also p. 3). These relationships depend so much on the influence of different factors that they cannot be expressed analytically, and apparently minor variations in curve shape correspond in the visual evaluation of the final result to quite important differences.
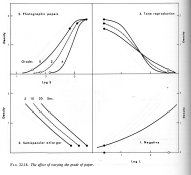
Thanks to Jones' simple graphical method it is possible to obtain complete information on the reproduction of tones by a given system. The basic idea underlying this method is to employ the axis of ordinates of a first graph—in which for instance the luminance scale of the original subject has been transformed by the first parameter of the system, the flare light in the camera—as the axis of abscissas of a second graph which gives the transformation due to a second parameter, for instance the sensitometric characteristic of the negative, etc. Taking into account all operations intervening during the process of photographic reproduction, it is possible to construct the tone reproduction curve with precision, so that not only any given system can be evaluated, but also all parameters, and especially the exposure and processing conditions can be chosen for optimum results."
In
The Encyclopedia of Photography, under the entry "Jones Diagram" it says "See Quadrant Diagram."
The Manual of Photography: Photographic and Digital Imaging, Chapter 15 Sensitometry, page 237, "It has been found valuable to employ graphical methods to study the problems of tone reproduction, one very useful method being the so-called quadrant diagram originated by L.A. Jones. This enables practical problems in tone reproduction to be studied, and solved scientifically."
Controls in Black and White Photography, 2nd Edition, Chapter 8, The Relationship Between Original Scene and Final Print,page 241, "The first method depicting these transitions is that introduced by Jones in 1920."
Exposure Manual, 4th Edition, J.F Dunn & G.L. Wakefield, Chapter 1, page 20,
"For the benefit of those interested in pursuing this mater further, however, it should be mentioned that the "windmill" diagrams illustrates an extremely valuable aid to the study of tone reproduction problems generally, and this method has been used by a number of workers for some years in order to obtain a much fuller story of tone reproduction than can be included here - for example to determine the influence of such important additional factors as the subjective viewing of the original scene and the final print under various lighting conditions, the effect of flare in the camera, the influence of illuminant size, film graininess and flare in the enlarger. All this was very adequately summarized by Loyd Jones in the Sixteenth Hurter & Driffield Memorial Lecture to the Royal Photographic Society in 1949, entitled Recent Developments in the Theory and Practice of Tone Reproduction, and readers who wish to study this interesting branch of the subject can hardly do better than refer to this accordingly."
From a paper by Jones in The Photographic Journal based on his Hurter & Driffield Memorial lecture. "Since that time the contributions of the theory and practice of tone reproduction have been many and varied. Much of this material has been summarized and analyzed by Dr Mees in his book The Theory of the Photographic Process, published in 1942. It is the intention of the present paper to pick up the story at approximately the point where it was left by Dr Mees in that publication... The general over-all theory of photographic tone reproduction has been discussed many times before and it is felt, therefore, that a greater contribution to this problem can be made only by dealing with it in a rather detailed fashion. To do this, the solution of an elaborated tone reproduction diagram, illustrated by a quantitative example, will be carried through."
An example from the paper.
