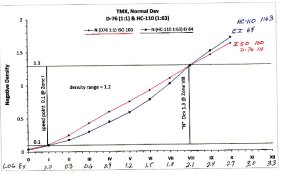
For those who are still here and still interested, I found a previous film curve example of Chucks.
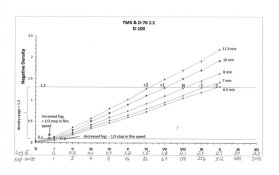
Here is the curve family that I ultimately arrived at for d-76 1:1 and TMX, absent any flare factor of course. What I found interesting with the test for EI is that it actually turned out to be 100 for me as the curve reached the Zone VIII target , just about right on the money. When +2 dev is planned, I reduce the exposure by 1/3 stop due to increased fog density and when -2 dev is planned, I increase the exposure by 1/3 stop due to reduced fog density. The curves don't show enough deviation in fog density at +1 and -1 to make a similar exposure adjustment. To date, these times have worked beautifully for me, of course, all I have to offer is my own anecdotal evidence of my own analysis and I'm not able to offer any more than that.
The "N" development comparison curves just represent, for me anyway, marked behavioral differences between d-76 and hc-110 with TMX in each of the three divisions of the curve (toe, straightline, shoulder). Knowing the CI values of each curve would be informative, I guess, but no decision would hinge on it. I evaluate differences in CI, figuratively speaking, in each major division of the curve when compared to another, in this way, the entirety of the curve is given full attention. Perhaps this explains my somewhat simplified point of view better, IDK.
I'm obviously not a technical minded as you and Bill because my road to the end result, seems just my own, within the confines of this thread that is, but I do take it seriously and find it interesting. If you are dieing to know the development times for the curves you posted last night, I arrived at:
At neg density 1.3, based off of development times from between 4 and 8 minutes and using Zone VIII as my target high value:
+2 dev, Zone VI (at log exp 1.5) = time interpolated at 7:30
+1 dev, Zone VII (at log exp 1.8) = time interpolated at 6:45
Normal dev, Zone VIII (at log exp 2.1) = ~6:00, the curve is within the range of 1.25 to 1.35
-1 dev, Zone IX (at log exp 2.4) = ~5:00, the curve is within the range of 1.25 to 1.35
-2 dev, Zone X (at log exp 2.7) = ~4:00, the curve is withing the range of 1.25 to 1.35
If I knew the ISO, I would break down my evaluation of the EI's for those four curves.


 . You do that and and admit how horribly wrong you are with these assertions and I'll provide you with an answer, gladly.