Hiding in Plain Sight

about to extinct

D
about to extinct

  • 1
  • 0
  • 67
Fantasyland!

D
Fantasyland!

  • 9
  • 2
  • 123
perfect cirkel

D
perfect cirkel

  • 2
  • 1
  • 125

Recent Classifieds

Forum statistics

Threads
198,748
Messages
2,780,334
Members
99,694
Latest member
michigap
Recent bookmarks
1
OP
OP
Stephen Benskin
Joined
Jan 7, 2005
Messages
2,612
Location
Los Angeles
Format
4x5 Format
I’ve been reviewing some old papers and I’ve run across something interesting. While the concept is one that is very familiar, it is expressed well. It comes from a paper by Allen Stimson, Measuring and Judging Photographic Exposure of Color Film for Automatic Exposure Controlled Cameras.

“Correct exposure can be judged from the appearance of a color transparency, although it may be evaluated differently by different people. Each observer thinks the correct exposure is that which he prefers. If different exposures of the same scene are judged by several observers, the one preferred by the majority is called the ‘preferred picture exposure.’ The exposure that will be preferred cannot be exactly predetermined, and different observers may not agree closer than +- 1 Ev.

On the other hand, exposure within +-0.5 Ev of the preferred picture exposure can usually be predetermined by photometric measurements of a scene quite satisfactorily for most amateur work. An experienced photographer can often improve the indicated exposure by judging the brightness of the subject in comparison with the general scene conditions measured by the meter, although for many types of scenes, he cannot know in advance the lightness or darkness of the subject matter which will best express the desired mood. Consequently, in important situations, he will make three exposures to bracket the range indicated by the meter.

It is necessary to recognize this fundamental difference between photometric measurement of exposure and preferred picture judgment of exposure. One is foresight while the other is hindsight; the former can be precisely measured and expressed in numbers, while the latter can be found only by judging finished pictures. The two are equal for the statistical average scene.”


And from later in the paper:

“It has been found that, in judging a sequence of identical pictures having different exposures, observers may differ in their exposure preference for some types of scenes by as much as +-1 Ev. They usually disagree on scenes of lower contrast.

A film may be judged to be overexposed when the sky area loses its color or when flesh tones appear to be washed out. It may be said to be underexposed when the area of greatest interest to the observer is darker than preferred. These criteria are often related to the photometry of the scene only through statistics.”

And this is with the small tolerances of color reversal film. Think what the range of preferred picture exposure is with black and white negative film means. Then consider the practicality of the concept of correct exposure, or maybe consider what having a difference between a photometric correct exposure and a preferred picture exposure. Finally, what does this say about an individual’s anecdotal observations about the effectiveness of their personal exposure methodology? Perhaps for their conclusions to have any real validity, they should be evaluated from both the photometric exposure and preferred picture exposure perspectives.
 
Last edited by a moderator:

markbarendt

Member
Joined
May 18, 2008
Messages
9,422
Location
Beaverton, OR
Format
Multi Format
I do find the discussion interesting and I've gotten some great ideas and appreciate the info you have provided Stephen.

There are certain limits though in applying the ideas, what I mean by that is that it has to fit into the larger context of taking and printing a photo.

For example I actually find the biggest practical challenge in judging and getting good exposure is not in how to get a single SBR exposed well, but in how to get competing SBRs (subjects) to fall properly in relation to each other on the film so that they will fall properly on paper.

The question for me is not just how do I get what's in front of me but, how do I manipulate the scene to get what I want?
 
OP
OP
Stephen Benskin
Joined
Jan 7, 2005
Messages
2,612
Location
Los Angeles
Format
4x5 Format
I like to think of it as similar to what people who know the Zone System or Beyond the Zone System tell those who are contemplating learning the methods. It takes effort at first to understand it, but it will eventually free you up creatively.
 
Last edited by a moderator:

markbarendt

Member
Joined
May 18, 2008
Messages
9,422
Location
Beaverton, OR
Format
Multi Format
I do agree Stephen. Understanding enough pieces of the puzzle allows us to concentrate on other things.

That's not where we start though, we learn/refine the pieces we go.

Creatively we always get to a result, the difference in understanding and not, is simply whether we can repeat things reliably or not.
 
OP
OP
Stephen Benskin
Joined
Jan 7, 2005
Messages
2,612
Location
Los Angeles
Format
4x5 Format
This is a bit of a coincidence. I just found a paper I’d copied years ago and then forgot about. It not only fits the topic of this tread. It was hiding in plain sight, but it also addresses some of the questions that have arisen here; and I’m not even finished reading it yet. The paper is from D. Connelly, The Specification of Conditions for the Incident Light Method of Exposure Determination.

These two excepts have so far stood out.

“It is of interest to note that the manner of determination of the constant is not a photographic one. The assumption is made that if an exposure meter is adjusted first so that it gives satisfactory information about photographic exposure (by using it and adjusting it to give satisfactory photographs) and is subsequently tested as above to determine the constant then the constant and the ability to provide correct exposure information are related consistently.”

And about distinguishing the two values of C:

“The way in which exposure meters should be used for either the reflected or the incident light methods is not given directly in the specifications [standards], but it can be inferred from the methods given for their calibration and checking. For calibration of the meter for the reflected light method its photo-cell is subjected to illumination from a screen having uniform brightness. This is a sufficient condition to ensure that the calibration and subsequent use of the meter are similar.

For calibration of the meter for incident light method the meter, together with whatever light pick-up device is used, is subjected to illumination from a point source of light situated on its optical axis. A reasonable inference from this condition might be that in use the exposure meter with pick-up device should be directed towards the source of maximum illumination. In practice, as has been noted previously, the recommendations include aligning the exposure meter axis with the direction of maximum illumination, or aligning it with the camera axis or doing both of these things and finding an average.

Here the calibration conditions and the manner of use are not necessarily similar, largely because of lack of information in the specification. It can be inferred that the type of pick-up which it is intended should be used is that which at the time the specification was issued was most prevalent, and on this basis it is presumed that a flat translucent screen placed over the photo-cell of the meter is the requirement.”


Happily and surprisingly, this supports what I hypothesized back in post #44. The difference between the old single value of C and the modern cardioid value of C was just about equal to the ratio between the two modern versions of C.

This paper was published in 1963. As far as I know, the first standard to have a distinction between the cosine receptor and cardioid receptor wasn’t until 1974.

I hope the rest of the paper is as interesting.
 
Last edited by a moderator:
OP
OP
Stephen Benskin
Joined
Jan 7, 2005
Messages
2,612
Location
Los Angeles
Format
4x5 Format
As I've said, I find these threads to be, probably, the most value-add on APUG.

Thanks. That's very kind.

What's worse is often people don't even see the results. They think they see something, based on what they've been told should be there (by people like Barnbaum and many others).

My favorite is the rumor that Alan Ross has discovered a negative density range of 1.45 for normal. That one always makes me laugh. If there's nothing else I've gotten out of studying theory it has to be a pretty good BS meter.

Seriously, we all learn in stages, and it's hard, if not impossible, to see beyond to the next stage. We probably all have to go through the "Mr Photo said this" and "I've heard about that" stage. We also tend to learn only when we are ready to learn it. The number 42 from Hitchhikers Guide to the Galaxy has little meaning unless you are ready to understand the question. (This thread is kind of about that point.) We all have to first earn the rules before we can begin to understand their limitations, tolerances, nuances, and variances. Some are comfortable just understanding the rules of use, which is fine. Some aren't.

For me, I was working in a photo lab and wanted to understand more about what I was doing. I read all the books I could get my hands on, but most of the ones knew about or could find weren't specific enough, then Jack Holm sent me a paper he had written. It had many of the specifics I was looking for including exposure equations, and more importantly it had a bibliography of other source materials. Papers that explained the thought processes that lead to the equations in Holm's paper. His paper and bib opened up a whole new world. But as my math skills suck, it didn't turn out to be a speedy journey of discovery.

That's one of the reasons why I give my sources and upload papers. It's also one of the reasons why I participate on this forum. You never know what that trigger could be. But it can be hard at times dealing with the Alan Ross rumors.
 
Last edited by a moderator:

Chuck_P

Subscriber
Joined
Feb 2, 2004
Messages
2,369
Location
Kentucky
Format
4x5 Format
My favorite is the rumor that Alan Ross has discovered a negative density range of 1.45 for normal. That one always makes me laugh. If there's nothing else I've gotten out of studying theory it has to be a pretty good BS meter.

"Discovered" a negative density range? Where did you determine that? That sounds good to say I guess, but is baseless, IMO.

Criticism only has merrit if your facts are right, wouldn't you agree?

It is, from what I can tell, simply an idea he has of considering calibrating a "normal" development time by targeting a Zone IX density of 1.45 rather than at a Zone VIII density of 1.3 for the reasons that you can laugh at here; but please, do tell where you can prove a discovery is being proclaimed. I've no idea if he ever followed through with it, but I would find it interesting to see his results.
 
OP
OP
Stephen Benskin
Joined
Jan 7, 2005
Messages
2,612
Location
Los Angeles
Format
4x5 Format
The subject of the sentence was about how rumors and hearsay are sometimes presented as information. That is the funny part, not Ross. The use of the word "discovery" was used in a humorous way.

To seriously address the substance of the rumor, see posts 1,7,9,10,11,13,16, and 18.
 

Bill Burk

Subscriber
Joined
Feb 9, 2010
Messages
9,290
Format
4x5 Format
To be fair to Alan Ross, he's not claiming a density range of 1.45. He's claiming a target upper density of 1.45

The lower end of his density appears undeclared but if I guess it is around Zone II, 0.3 - this would lead to a density range of 1.15 only .1 more than the normal 1.05 we've been talking about.
 
OP
OP
Stephen Benskin
Joined
Jan 7, 2005
Messages
2,612
Location
Los Angeles
Format
4x5 Format
but if I guess

Is that anything like assume?

I'd like to get back to why finding out the reason for the differences between the value of C in the older standards and the value in the current standards. I knew that the average illuminance couldn't have changed, so there had to be another reason for the lower value. But was it something having to do with the physical properties of the exposure meter or how the exposure meter is used? Finding out that the earlier testing was done with the flat disk (cosine) receptor means there is a consistency of agreement over time. That most of the real differences in the value of K and C can be attributed to the conditions under how the meters are tested.

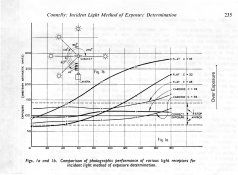
Another interesting tidbit of information from the paper is that the value of C can change with the thickness of the receptor. Here's a graph from the paper Comparing the photographic performance of various light receptors for incident light method of exposure determination. The bottom axis is the angle of the sun in relation to the direction of the camera. The exposure meter is placed in front of the subject pointed toward the camera.

Light Receptor Performances.jpg

The findings:

"From the curves shown, it would appear that the flat pick-up does demonstrate an error in exposure determination which increases progressively. For the pick-up with constant 35 the meter indication give reasonably near correct exposure for frontal lighting and become progressively more in error towards over-exposure as the angle of incidence increases, whilst the pick-up with constant 22 give under -exposure for frontal lighting progressively tending towards over-exposure for back lighting.

For both receptors the error is appreciable at 180 degrees, that is, for back lighting.

It will be observed that the pick-up with cardioid type characteristic gives approximately the same error in exposure at all angles of incident illumination and further that when the constant is about 35 to 38 reasonably nearly correct exposure is obtained."

The conclusion:

"...the results of the test as summarized in in the curves of Fig 1 demonstrate that the receptor with cardioid type pick-up characteristic can give satisfactory exposure determination by means of a single reading for any angle of incidence of the maximum illumination on the subject.

For this condition to be met, the photographic constant C as defined and determined in standard ASA Specifications must be about 35 to 38, whilst a tolerance of +-5 is permissible on the figure adopted.

The flat plate type of receptor an be seriously in error when the angle of receptor is over about 90 degrees but may give reasonable results for angles less than about 90 degrees."


The ability for the cardioid receptor to produce acceptable results in in all conditions was probably why it was adopted as the primary value of C. The next question is why the difference between the recommended value of 35 and the adopted value, in the ANSI 1971 standard of 30. Interesting enough, that standard appears to switch from the cosine value of C to the cardioid value instead of keeping the value for the cosine receptor and creating a separate value for the cardioid receptor.
 
Last edited by a moderator:

Chuck_P

Subscriber
Joined
Feb 2, 2004
Messages
2,369
Location
Kentucky
Format
4x5 Format
To be fair to Alan Ross, he's not claiming a density range of 1.45. He's claiming a target upper density of 1.45

The lower end of his density appears undeclared but if I guess it is around Zone II, 0.3 - this would lead to a density range of 1.15 only .1 more than the normal 1.05 we've been talking about.

The print is very small, but on the graph it states that the Zone I density target is .09.
 

Bill Burk

Subscriber
Joined
Feb 9, 2010
Messages
9,290
Format
4x5 Format
Alan Ross has talked of placing shadows on Zone III (or IV, I can't find the reference right now). But keying highlights at 1.45 is not a bad idea for 4x5 and larger negative film. It may be bad for 35mm (if minimizing grain and maximizing other attributes is critical for you). But landscape, pictorial, black and white on a tripod is not hurt at all by placing exposure higher than the minimum.

I also think you are onto something thinking earlier meters had only a flat disk. Possibly the "engineering" developments and early meters were used for architectural lighting/illumination work where the meter is aimed to the light source.
 
Last edited by a moderator:
OP
OP
Stephen Benskin
Joined
Jan 7, 2005
Messages
2,612
Location
Los Angeles
Format
4x5 Format
To be fair to Alan Ross, he's not claiming a density range of 1.45. He's claiming a target upper density of 1.45

The lower end of his density appears undeclared but if I guess it is around Zone II, 0.3 - this would lead to a density range of 1.15 only .1 more than the normal 1.05 we've been talking about.

I found it at http://www.alanrossphotography.com/category/tech/zonesystemandmetering/

You're right. It's hard to read. And it’s not about an idea for a new negative density range, but a different set of points to determine contrast. Ross was having problems with negatives from scenes with longer than normal luminance ranges. He found that by adjusting point where the contrast is determined, the resulting negative contrast produced tended not to block up.

This is definitely an important issue. I attempted to create a discuss it in a recent thread, “Average Gradient Methods.” The goal of any method of contrast determination is for the area of the test to agree with the area of usage. As the area of usage changes the ideal method would change with it as well as take in various factors such as flare.

The method that has good agreement between the testing results and the results from use in the greatest range of situations is considered the optimum approach. Almost any method will produce good results under more specific and limited conditions. Generally this tends to fall around the statistical average conditions. The further away from this situation, the greater the degree of error.

A discussion on the strengths and weaknesses of the different methods of contrast determination could be a worthy one.

There's something about Ross's examples that falls under hiding in plane sight, the Zone indicated steps along x-axis. They are all equally spaced? The two example don't incorporate flare into the testing.
 
Last edited by a moderator:

Bill Burk

Subscriber
Joined
Feb 9, 2010
Messages
9,290
Format
4x5 Format
Alan Ross has talked of placing shadows on Zone III (or IV, I can't find the reference right now).

I can't find the reference because I don't think there is any. Alan Ross didn't talk of placing shadows high. I believe I confused him with John Sexton. Apologies. I can't say where Alan Ross places his shadows, and I didn't mean to put words in his mouth.
 

Chuck_P

Subscriber
Joined
Feb 2, 2004
Messages
2,369
Location
Kentucky
Format
4x5 Format
There's something about Ross's examples that falls under hiding in plane sight, the Zone indicated steps along x-axis. They are all equally spaced?

Each zone separated by 0.3 log exposure units i.e., one stop differences. Just curious here........what is wrong with that?
 

Bill Burk

Subscriber
Joined
Feb 9, 2010
Messages
9,290
Format
4x5 Format
Each zone separated by 0.3 log exposure units i.e., one stop differences. Just curious here........what is wrong with that?

The diagram is slightly simplified because it leaves out the effects of flare, which can make shadows land higher in density on the film than you previsualized.

Flare is exposure applied over the whole sheet of film. It messes up the neat 0.3 exposure units.

You can visualize flare exposure more easily using an arithmetic scale instead of logarithmic scale. Arbitrarily call Zone I = 1, and arbitrarily call it one stop of flare. Then you wind up with this series and you can see that the shadows are tweaked more than the middle tones, and above that you can just as well ignore it.


Zone I = 1 + Flare 1 = 2
Zone II = 2 + Flare 1 = 3
Zone III = 4 + Flare 1 = 5
Zone IV = 8 + Flare 1 = 9
Zone V = 16 + Flare 1 = 17
Zone VI = 32 + Flare 1 = 33
...
 

Chuck_P

Subscriber
Joined
Feb 2, 2004
Messages
2,369
Location
Kentucky
Format
4x5 Format
The diagram is slightly simplified because it leaves out the effects of flare, which can make shadows land higher in density on the film than you previsualized.

Flare is exposure applied over the whole sheet of film. It messes up the neat 0.3 exposure units.

You can visualize flare exposure more easily using an arithmetic scale instead of logarithmic scale. Arbitrarily call Zone I = 1, and arbitrarily call it one stop of flare. Then you wind up with this series and you can see that the shadows are tweaked more than the middle tones, and above that you can just as well ignore it.


Zone I = 1 + Flare 1 = 2
Zone II = 2 + Flare 1 = 3
Zone III = 4 + Flare 1 = 5
Zone IV = 8 + Flare 1 = 9
Zone V = 16 + Flare 1 = 17
Zone VI = 32 + Flare 1 = 33
...


Thank you.

I liken flare to the effect of pre-exposure, except that pre-exposure, when given, is intentional and controlled where as flare is always present, random in intensity, and very hard to quantify and that it is applied over the entire sheet of film. Like pre-exposure, adding one unit of flare, in your example, Flare I, amounts to proportionally less and less increases in negative density moving up the scale of zones. Flare's potential affect in the lower zones is given, its actual significance quite negligible in many instances IMO. I always shield the lens best I can, I may sometimes, if ever I feel it can pose a more significant problem, make just a small exposure adjustment.

In terms of evaluating a curve for determinatin of EI, however, I don't see much point in including some factor for flare, but that is just me, not at all saying it's pointless for anybody to do so. I can only report that not including it, seems not to have had any dramatic influence on any negative I have ever produced since becoming proficient in my use of the ZS and the associated testing. All of Ross's curves presented on that link have been adjust for EI (although the example doesn't indicate what they are, only that they've been adjusted), hence the reason that they all originate from the same location at Zone I. I ask myself how a flare factor could influence my evaluation of those curves for applied photography (or my own for that matter), I always arrive at the same answer, it doesn't, but I understand its potential affect for any given exposure, which is what I think is ultimately more important. I find the overall discussion interesting and I appreciate the knowledge base.

Chuck
 
OP
OP
Stephen Benskin
Joined
Jan 7, 2005
Messages
2,612
Location
Los Angeles
Format
4x5 Format
Flare not only changes where the shadow exposure falls, but also reduces the scenes luminance range at the film plane. In Bill's example flare changes a 1:32 scene into a 2:33 scene at the film plane. 2:33 can almost be reduced to 1:16.

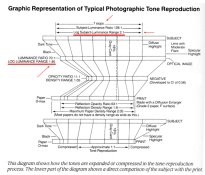
Take another look at the Kodak diagram from post #1.

Kodak tone reproduction graphic b.jpg

At the top is the subject. It has a range of 7 stops or log 2.10. Flare reduces this range within the camera. Here they call it the Optical Image. It now has a range of 1.85 logs or a touch over 6 stops. The film is then processed for the six stop range, and not the original 7 stop range. Mathematically it's very simple. To find the illuminance range of the subject at the film plane, you subtract the amount of flare from the subject luminance range. In the case of the Kodak diagram: 2.10 - 0.25 = 1.85.

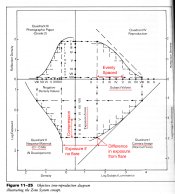
The next example is from Photographic Materials and Processes.

Materials and Processes - Zone 4 Quad.jpg

I was told it was the text book for first year students at RIT. Quadrant I, the lower right quadrant, represents the camera image. At the top are the Subject Values or original subject. Here the stops are equally spaced. Flare from the optical system changes the relationship of the original subject values. The values that strike the film, the dividing line between Quadrant I and Quadrant II, are no longer equally spaced as flare has compressed the lower values.

A common mistake when interpreting a film curve is to apply the equally spaced values of the original subject along the log-H axis instead of the values from the camera image.

When does flare not exist? It is with the contacting of the step tablet in testing conditions. In order to have a realistic representation of how the subject is reproduced on the film curve when shot with a camera, flare must be incorporated when making interpretations. So, no flare when creating the characteristic film curve. Flare when interpreting the film curve. It's the difference between testing and interpreting.

Post #13 has the CI / Negative density range chart that Kodak uses. The only way for the values to work out as they are in the chart is to apply a fix flare value of 0.40. Flare is factored in. Film manufacture's development recommendations have a value of flare already calculated into it. Film speed has it factored in. It's just that it's extremely hard to notice something that is normally there. Flare only becomes noticeable to most people when it is excessive.

With a front lit scene, 80% of the flare comes from the subject itself. Shading the lens will only help control the other 20%.

The answers are out there hiding in plane sight for anyone willing to look for them.
 
Last edited by a moderator:

Bill Burk

Subscriber
Joined
Feb 9, 2010
Messages
9,290
Format
4x5 Format
When does flare not exist? It is with the contacting of the step tablet in testing conditions. In order to have a realistic representation of how the subject is reproduced on the film curve when shot with a camera, flare must be incorporated when making interpretations. So, no flare when creating the characteristic film curve. Flare when interpreting the film curve. It's the difference between testing and interpreting.

It's isolating the variables and incorporating them one-by-one wherever possible. I agree it is hard to estimate flare.

I am starting to think that keying development on higher zones (Alan Ross' self-titled heretical approach) may have its advantages. You probably have a higher probability of "calling your shots" when you try to control somewhere far away from the out-of-control low Zones.

Though I see the merit in Ross' heresy, I still spot my shadows for Zone II, and alter my EI to make Zone II fall on the film curve where I want Zone II (so I include flare). I haven't made my mind up where I want that to be, and this thread is guiding me towards that decision. Today my TMY-2 EI is 250 and it seems to be working out.
 

Chuck_P

Subscriber
Joined
Feb 2, 2004
Messages
2,369
Location
Kentucky
Format
4x5 Format
With a front lit scene, 80% of the flare comes from the subject itself. Shading the lens will only help control the other 20%.

The answers are out there hiding in plane sight for anyone willing to look for them.


It has just always been my belief, that the image brightness range is more often than not, pretty close to the subject brightness range (obviously not perfectly in any instance) with a great deal of that owed to high quality multi-coated lenses. Now, although there is nothing at all from me to scientifically substantiate that in anybodies mind, it is quite emperically accepted in mine. I simply believe in the end, that a greater percentage of flare is mitigated than what is being discussed.

Your're right, I guess there is a lot that can be hiding in plain sight, but with that being so, the need must arise to seek before there's a desire to go searching.
 
OP
OP
Stephen Benskin
Joined
Jan 7, 2005
Messages
2,612
Location
Los Angeles
Format
4x5 Format
Like I said, flare and many other factors are incorporated into photography. Photographic scientists and engineers have worked hard in order to make photography work without having to understand it. As I've shown, flare is also incorporated into the Zone System, albeit unintentionally. For those wanting to discuss and understand the photographic process with all the factors that come into play within the process, they should be part of defining, analyzing, and explaining the process else there will be a gap in understanding how it works.

There's an easy way to extrapolate what is considered normal flare. Kodak considers a CI 0.58 for normal processing. The LER for the middle of a grade 2 paper range is 1.05. The average scene luminance range is 2.20 logs.

1.05 / 2.20 = 0.477

Take off a stop from the luminance range

1.05 / 1.90 = 0.553

Close but not exact. Take off another 1/3 stop.

1.05 / 1.80 = 0.583

So, Kodak considers the average flare to be 1 1/3 stops. Flare is part of their normal.

Flare helps make sense of the photographic process.
 
Last edited by a moderator:

Bill Burk

Subscriber
Joined
Feb 9, 2010
Messages
9,290
Format
4x5 Format
Stephen, I've brought this up before but not sure if we really discussed testing methodology. When I do film tests for EI, development times etc I do it in-camera, and photograph a very brightly (and uniformly) lit white card. Picture a makeshift copy stand sort of setup. I always thought this would effectively factor in some flare, and be a better way of testing for my applications than step wedges. Although admittedly it is not a perfect test, do you think I'm getting at least some flare factor?

You are effectively factoring in shutter speed and f/stop when you do a camera test.

The uniform lighting and low exposure placement reduces flare when you do a test like that.

Flare is going to hit you when you take a normal picture and the bright sky lights up the surfaces of the lens and interior of the camera. Then you end up giving the shadows an additional stop or more of exposure than you thought you were getting.

You can test for your camera's flare with a "black box" included in a variety of scenes.
 
OP
OP
Stephen Benskin
Joined
Jan 7, 2005
Messages
2,612
Location
Los Angeles
Format
4x5 Format
Stephen, I've brought this up before but not sure if we really discussed testing methodology. When I do film tests for EI, development times etc I do it in-camera, and photograph a very brightly (and uniformly) lit white card. Picture a makeshift copy stand sort of setup. I always thought this would effectively factor in some flare, and be a better way of testing for my applications than step wedges. Although admittedly it is not a perfect test, do you think I'm getting at least some flare factor?

There are a whole slew of variables that come into play when testing and many of them aren't even considered by most people. Some of them that do, aren't really realistic. When it comes to flare, think about the camera image. You are taking a white card and stopping down. The characteristics of the camera image don't change. The camera image curve is just moved up or down with changes of exposure. There is no influence of flare by the time it gets to the higher tones, and that's with a scene with a normal luminance range.

Another way to look at it is the ratio of the metered exposure to the speed point verses the ratio of the metered exposure to the average shadow exposure. With black and white, the ratio to the speed point is 10x or 1.0 logs. The ratio for the shadow exposure is 20x or 1.30 logs. The difference comes from flare. The ISO standard factors in around a stop flare. If camera testing incorporated flare then the majority of of the resulting film speeds resulting from stopping down 4 stops (1.20 logs) from the metered exposure would result in the ISO speed. But as most tend to fall 1/2 to 1 stop below, that suggests a mostly flare free testing environment.

You can do the test that Bill suggests if you want to have an idea of how flare works, but as flare is variable not only with the luminance range but with the tonal distribution of the subject and lighting angle, it would be hard to apply the testing results to shooting. The best thing to do is to use the average value. Not only does it represent the results from the majority of situations, it is also the center of all possible outcomes which helps to minimize the degree of error.
 

Bill Burk

Subscriber
Joined
Feb 9, 2010
Messages
9,290
Format
4x5 Format
What if the lens is wide open and I'm using shutter speeds to control exposure? Wouldn't flare from a brightly lit white card be in play even though I'm exposing for low values?

You have a really low contrast image at that point. Even if it is white, there's going to be less than a stop of subject brightness range. And assuming you are exposing at a fast shutter speed to measure low Zones, you are really underexposing the white (to make it almost black). Your flare is about four stops beneath that, barely causing an effect.

Now if your camera had a light leak, that'll give you flare.
 
Photrio.com contains affiliate links to products. We may receive a commission for purchases made through these links.
To read our full affiliate disclosure statement please click Here.

PHOTRIO PARTNERS EQUALLY FUNDING OUR COMMUNITY:


Ilford ADOX Freestyle Photographic Stearman Press Weldon Color Lab Blue Moon Camera & Machine
Top Bottom