This thought occurred to me...
As I strive to figure out the lower EI that most Zone System users settle on vs box speed...
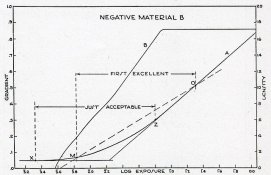
Loyd Jones' tests were the first excellent print, right? He sent the films off to the lab to make the best print they could of each negative. The first excellent print might have been on Grade 4 paper for all I know, the guys in the lab were doing their best.
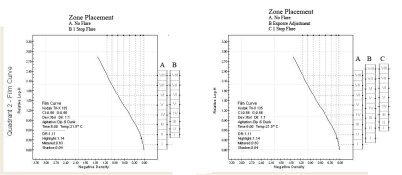
Zone System tests aim to fit onto Grade 2 paper. So this could be another factor why the EI is lower for Zone System users.
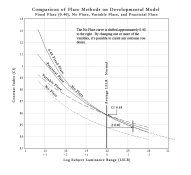
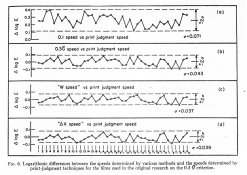
It's been awhile since I've done a thorough reading of the paper so... What they did was make a bunch of negatives from master transparencies varying the exposure and processing. A bunch of prints were made from each of the negatives. The prints were judged for quality and then they went back to determine the sensitometric conditions that produced the best quality images. Finally, they had to come up with a way to determine a film speed that would be in agreement with the results they got in the psychophysical testing. Technically, the best method for speed determination is with psychophysical testing like the first excellent print. It's just not practical to do. What is regarded as the best method to determine film speed would be the mathematical approach that will give results as close as possible to the psychophysical test with the greatest number of different types of film. Attached. Notice the fixed density 0.10 method has the worst results?
There's a concept that I've been thinking about having to do with considering the guidelines used for the judges. They instructed the people judging the prints to base their standards of quality on prints that they thought best produced an impression of what they believed the original scene would look like if they were there. In other words, prints that most closely looked like reality.
What if the intention of the photographer isn't about making the finished print "look" like the original scene? Wouldn't that mean the judging conditions of the testing that determined film speed no longer applies? So the film speed value is, in a way, no longer accurate? Of course, there needs to be some kind of standard in order to have a base to work from and be able to compare apples to apples, but something to consider.
The subjective element of photography is the saving grace of so many "systems." If the intent was to reproduce something exactly, there wouldn't be a debate.
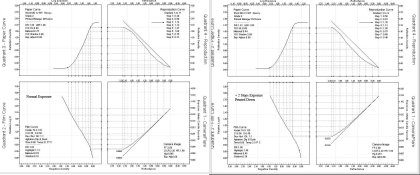
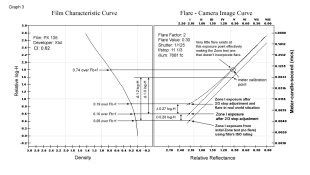
And no, the reason the Zone System speeds are different from the ISO speeds is because the testing methods have different parameters and assumptions. ISO the shadow is 4 1/3 stops below the metered exposure point, but the speed point is 3 1/3 stops because they factor in flare. Zone System has the shadow 4 stops below. EI has to be adjusted by 2/3 stop to bring it up to the 0.10 Fb+f speed point. Also attached is a example from an article I wrote for PHOTO Techniques. For the record, speed point isn't necessarily the point were a specific exposure is supposed to fall (eg shadow exposure), but just a knowable place to calculate film speed.
There are reasons why people haven't caught this, and quality isn't one of them. A little extra exposure doesn't degrade quality and can be considered a good idea, even if you're not aware of it. But I think it's important to keep in mind there's a difference between film speed and preferred exposure.