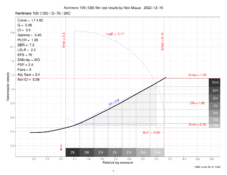
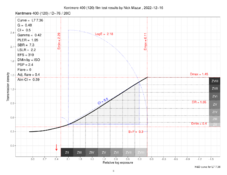
Aparat....for those of us who can read negatives & print...you know...practical application...but don't do graphs.... can you offer an interpretive meaning in a few sentences.
As a simple summary, the curves he presents where there are multiple developing times show the exposure ( amount of light) the film received on the bottom and the corresponding density built on the negative on the vertical axis. A straight line means that there is a direct correlation between exposure given and resulting density of the film. Suppose you increase the exposure from one point to another by a stop, in the straight line portion the resultant change in the negative will also be one stop (if it is a 1:1 relationship - the important thing is it's a constant relationship). If the curve is more of an S curve, then there isn't that direct relationship anymore, so a stop more exposure might only increase the negative density by 1/2 a stop - you'd have to know exactly where on the curve you are to know the relationship. Depending on where you are on the curve, it can result in highlight tones being compressed together for example, or poor separation in the shadow tones. So if you see a long straight line portion of the graphs, it should be an easy film to work with for most circumstances. It will be a predictable film.
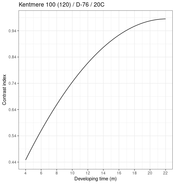
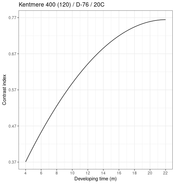
The slope of the line in the straight portion represents the contrast index. For a normal scene, you are looking for a contrast index of about 0.58 to be able to capture both highlights and shadow detail and be able to print them on a normal grade 2 paper. From the family of the curves, you can then determine a "normal" developing time to give a 0.58 contrast level. In this way you can determine a custom developing time for any film and developer combination, developed the way you develop film - either in a jobo, small tank, trays when doing sheet film etc.
If you shooting a low contrast scene - overcast, fog etc, then you can determine what contrast level you need to bring your image highlights and shadows onto a printable range and choose a developing time and film speed to suit your scene. Effectively, you will likely be pushing the film - underexposing and overdeveloping, in order to steepen the line, which means to raise the contrast level. That will separate the small range of tones in a foggy scene and expand them to suit the paper.
In a "normal" scene, you take a light reading and expose the film, that exposure point should fall in the middle of the curve. The shadows will be near the bottom, but hopefully still on the straight line portion, and the highlights will be near the top, but also on the straight line portion. Then you have captured the full range of tones availble to be captured in your original scene, and it will be a printable negative. If you overexpose, you shift to the top and some highlight tones may fall beyond the range the film capture, so those are lost. If you underexpose, the shadows will be down in the toe ( or below it) and the film will not receive enough exposure to capture any information and you lose shadow detail.
If you are consistently getting negatives that are flat for example, then you can do these tests to find the optimum developing time. From these tests you can also determine the effective speed of the film. The way the slope of the curve in the bottom of the curve ( the toe) changes can be used to determine film speed. There is a lot of literature on determining film speed, it's a complicated subject. So by exposing and developing 5 test sheets of film you can determine both your developing time and film speed for your processing style and conditions.
More than a few sentences, but I hope that helps your understanding a bit of the charts that are being presented. There is a lot of information you can extract about how the film will behave if you can read the charts.


