

Nicholas is correct.
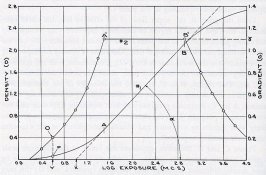
I would like to add again that the flat portion of the "bell" curve above, or dD/dLogE, the derivative, effectively describes the maximum usable latitude of a film. That is the flat or horizontal portion. The value in the above case appears to be incorrect on the y axis though as it should actually equal the gamma. Mees shows this in Fig 299 of his Revised Edition on P 870. He uses 2 y Axes, one is density and the other is gamma on the left and right respectively to remove the ambiguity.
In the above curve, the rise is about 0.2 units per 0.1 speed (if I assume log E) for a gamma of 2.0. If I have misinterpreted this, please accept my apologies. I would, of course, be wrong if the X axis were not in units of Log E.
And, the print gamma would be dD/dLogE film x dD/dLogE paper for each point allowing us to construct a "system" response assuming that the film and paper respond on a 1:1 basis.
PE
") that created "the first excellent print".
that created "the first excellent print". 