Stephen Benskin
Member
I have heard that "standard contrast" for negative film is 0.6, on the straight-line portion of the h&d curve. I have a couple of questions about this.
1. is this true?
2. Why 0.6 not 1?
3. Do manufacturers development data uniformly target this standard contrast value?
4. If I have papers from grade 0 to grade 5 at my disposal, how much tolerance does that give me with regards to the contrast of my negatives?
I am trying to determine if there is a development recipe that I can use with all the different films I use.
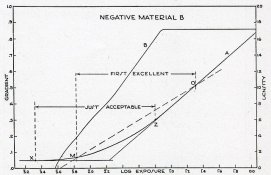
1. The standard is based on the statistical average conditions and the average paper grade. Loyd Jones determined the statistical average luminance range is 2.20 logs or 7.33 stops. Now this doesn't include the entire range from accent black to a pure specular reflections. This is all based on Tone Reproduction Theory which is a fascinating subject. Kodak had 0.56 as their normal of a couple of decades, but changed it to 0.58 because of the increased use of 35mm cameras which have a slightly higher average flare than larger formats. Flare went from 0.34 to 0.40 or 1 1/4 to 1 1/3 stops. According to the below chart published in Photographic Materials and Processing, the LER that falls in the center of the range for a grade 2 paper printed on a diffusion enlarger is 1.05. This also doesn't include the entire range of the paper.
1.05 / (2.20 - 0.40) = 0.58

2. Why not 1? The negative is not the final step in the process. Paper just so happens to be slight under 2.00 (~1.70) so the negative needs to be about half that in order the reproduction to equal 1.00. negative gradient x paper gradient = 1.00.
3. Manufacturers tend to follow the statistical averages.
4. Please see the chart above and the table I've uploaded. While matching the NDR to the Paper LER helps match the film to the paper, it doesn't account for the local contrast and how the print tones relate to the original values.
Other people have already pointed out the connection between 0.60 sounding familiar and the ISO black and white film standard. The number; however, can be misleading. While it is technically processing the film higher than normal, it doesn't make a change in the film speed when you consider the standard uses the Delta-X criterion for speed determination. Delta-X is a way to mathematically determine the placement of the fractional gradient point using an easy to find fix density point. The contrast parameters of the standard are part of the math. If the negative has a density of 0.80 at a Δ1.30 log-H from the 0.10 density point, the difference between the 0.10 and fractional gradient point is always 0.296. Only when these conditions are made can you determine accurate film speed. At other film gradients, the Delta-X equation must be used. As the film speed doesn't change very quickly with changes in film gradient, the slightly higher gradient for ISO testing does not give a false higher speed value.
Last edited by a moderator: