0.6 -- standard contrast?

Humming Around!

D
Humming Around!

  • 4
  • 0
  • 52
Pride

A
Pride

  • 2
  • 1
  • 100
Paris

A
Paris

  • 5
  • 1
  • 174
Seeing right through you

Seeing right through you

  • 4
  • 1
  • 208

Recent Classifieds

Forum statistics

Threads
198,414
Messages
2,774,588
Members
99,610
Latest member
Roportho
Recent bookmarks
0

Photo Engineer

Subscriber
Joined
Apr 19, 2005
Messages
29,018
Location
Rochester, NY
Format
Multi Format
During our surveys, the "customer" selected that as the "First Excellent" print. Yes. But the consistently better prints started at point "Z" and consisted of the straight line portion of the curve.

Just remember though that the densities read from a paper step wedge do not mach those "read" by the eye. To do this, we used that MacBeth viewing cabinet and set up a spot densitometer at viewing distance and read the step wedge. This change in angle and distance changed all of the data.

PE
 
Joined
Jan 7, 2005
Messages
2,609
Location
Los Angeles
Format
4x5 Format
The first of those I cite comes from the work of J. L. Tupper and was published in the '40s IIRC. Both Mees and Haist published variations on the second two from their work in the '40s and '50s. The work published by Mees was also originally done by Tupper and others on Mees staff.

PE

Page 502 Jones, Loyd, The Evaluation of Negative Film Speeds in Terms of Print Quality (conclusion), Journal of the Franklin Institute, April 1939.

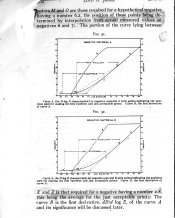
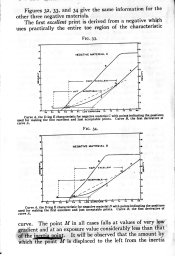
First Excellent Print curves page 500.jpg First Excellent Print curves page 501.jpg

There are four curves, on pages 502 and 503 each distinguished with a different letter representing different films used in the First Excellent Print Test as described in Jones' paper.

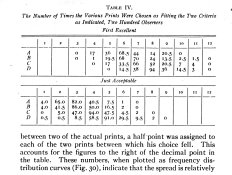
And here are two tables from page 508 showing the number of times various prints were chosen from negatives A-D as fitting the two criteria (Just Acceptable and First Excellent) as judged by 200 observers.

First Excellent Print curves table.jpg
 

Bill Burk

Subscriber
Joined
Feb 9, 2010
Messages
9,221
Format
4x5 Format
During our surveys, the "customer" selected that as the "First Excellent" print. Yes. But the consistently better prints started at point "Z"

Can't be "Z", that's 1.0 greater exposure (3 1/3 stops). But illustration-wise I see it's the start of the straight-line if that's what you mean. But I would think that's about 2/3 stop above "First Excellent".
 

Bill Burk

Subscriber
Joined
Feb 9, 2010
Messages
9,221
Format
4x5 Format
I have an example to illustrate 0.62 gradient on Grade 2 that I think proves PE is right. The best photographs are just a bit above the toe.

I rate TMY-2 at EI 250 which is 2/3 stop more exposure than its ISO speed.

I don't read densities on every negative I print, but I was happy with the print so I took some readings. I drew the readings on my curve family graph. I also sketched some "what-if" scenarios. What if I overexpose another stop? What if I overexpose a stop then underdevelop?

I didn't sketch on this graph but here's another "what if"... What if I had exposed the film at rated 400 speed? Our Bride to-be's hair might have measured 0.10 density. (Or maybe flare would have kept density a bit above 0.10).

I think rating at EI 400 would have made a perfectly fine negative. But I am still very happy to shoot TMY-2 at EI 250 because of the "safety factor" I give myself.

tmygraph.jpg


Link to the image that goes with this graph: (there was a url link here which no longer exists)
 

Photo Engineer

Subscriber
Joined
Apr 19, 2005
Messages
29,018
Location
Rochester, NY
Format
Multi Format
Bill, by "Z" I meant the straight line portion, so you have it right. In those days (the '30s) all films had soft toes and bowed mid scales and so it was hard to place this point, but it was "known" as the best low density region. We used the maxim that one should overexpose by 1/3 stop even into the '60s.

Now, as for the work by Jones, all of this devolves to EK work in the US at least, in the '20s to '40s. This work was summarized by Mees in his revised edition and by Haist in his 2v set. It "proves" nothing unless you have been in front of "customers" with a stack of prints and you have been asked to prove or disprove this theory of "first acceptable print". I have done this more than one time and it is a tried and true test procedure at EK.

Having had my work judged by Zwick, Bartleson, DeMarsh and others, and having done the tests I can say no more. Overexpose by 1/3 stop on average with soft toe films. And accept 0.6 as mid scale contrast with negative films as an average value when processed properly.

PE
 

Photo Engineer

Subscriber
Joined
Apr 19, 2005
Messages
29,018
Location
Rochester, NY
Format
Multi Format
Bruce, using a 21 step wedge, make an exposure onto your film of choice and process normally. Make sure that they all reach a contrast of 0.6. Now, compare the curves in the toe region. A soft toe film will have more steps in the lower densities. This is a soft toe film.

Now, it is clearly impossible to do all of this, so you can go to the mfgrs. web site and download and cross compare curves that way. Much simpler. I suspect that all EFKE films were soft toed with a bowed curve in the middle. I suspect that many European films are also built that way. It does make the image look more retro than the modern films.

And, I'm sorry that I cannot rattle these films off as I stick to my own brands and they satisfy me.

PE
 
Joined
Jan 7, 2005
Messages
2,609
Location
Los Angeles
Format
4x5 Format
During our surveys, the "customer" selected that as the "First Excellent" print. Yes. But the consistently better prints started at point "Z" and consisted of the straight line portion of the curve.

If I'm reading the graph correctly, Point Z is the highlight density of the "Just Acceptable" print. I'd love to see a specific example that defines this as the optimum point for shadow placement to substantiate the claim.
 

Photo Engineer

Subscriber
Joined
Apr 19, 2005
Messages
29,018
Location
Rochester, NY
Format
Multi Format
Acceptable print quality improves up the scale and then goes down again Stephen. Max is in the middle which is above "Z".

Have you ever run a test yourself with literally hundreds of prints? Maybe more?

PE
 
Joined
Jan 7, 2005
Messages
2,609
Location
Los Angeles
Format
4x5 Format
Acceptable print quality improves up the scale and then goes down again Stephen. Max is in the middle which is above "Z".

Have you ever run a test yourself with literally hundreds of prints? Maybe more?

PE

Ron, I made that statement on quality in an earlier post (#49). Don't talk to me like I don't understand basic concepts. I don't want condescension or an anecdote. I want facts. You were wrong in your conclusions from the First Excellent Print test. You were wrong about Tupper. You obviously overstate the degree of acceptable exposure. Extraordinary claims require extraordinary evidence. I'm just trying to limit the misinformation.

"Z" might happen to fall close to the middle of the curve, but that letter does not represent the middle. It represents where the highlight falls from the Just Acceptable print. Is my pointing out a detail in a graph grounds for your attempted slap down? A non-sequitur slap down at that. "Hey Ron maybe that letter is referring to something else." "Stephen: "If I'm reading the graph correctly, Point Z is the highlight density of the "Just Acceptable" print." Ron: "Have you ever run a test yourself with literally hundreds of prints?" Geesh.

Seriously Ron, were you attempting to use the curve and point "Z" as proof for shadow placement? Yes or no?

No I don't have the resources to do that degree of testing. But making arguments from authority doesn't prove anything either. Without data how do I know you are interpreting the results of your tests correctly? But most of all, I don't have to have to be personally involved to have knowledge. Without going into what type of a bad argument that is, let's just say it's BS.

I do know your opinions on negative exposure are outliers. I'm not saying giving a little extra exposure helps. Of course it helps shadow detail. That's not a big secret. But your position of only using any part of the toe only in an emergency is unsupported. Let's say you are right. Why hasn't the speed standard changed? Exposure actually decreased in the 1960 standard. Where they all stupid? Maybe if you talked condescendingly to them. The standards are up for review every five years. Why hasn't there been a conceptual change in the determination of film speed since Jones' Fractional Gradient?

And Ron, stop using strawmen. Just because I disagree with something you said or point out you made a mistake doesn't give you the right to attribute me with things I have not said or positions I do not support in an attempt to "prove" me wrong. I've presented no position on exposure. I only said your conclusion on the First Excellent Print test was wrong. You implied I was only interested in curves and photography, and that I didn't believe (or understand) exposure or tone reproduction (go read my posts on exposure (there was a url link here which no longer exists)) All just to avoid addressing your incorrect statement. This is unacceptable behavior. I don't know what can make you so insecure.
 
Last edited by a moderator:
Joined
Jan 7, 2005
Messages
2,609
Location
Los Angeles
Format
4x5 Format
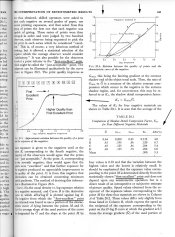
Page 441 (below example) from The Theory of the Photographic Process, Chapter 20, The Interpretation of Sensitometric Results, written by J.L. Tupper is part of 3½ pages devoted to Jones and his First Excellent Print test. The graph from post #51 was reproduced from Fig. 20.6 which is a reproduction of a graph used in Jones’ test. Table 20.1 is data from the test. While the chapter was written by Tupper, he did not conduct the test which is obvious from the text.

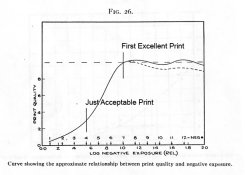
I’m showing this not just to set the record straight but to point out the graph in Fig 20.5. It shows the relationship between exposure and print quality as determined by the First Excellent Print test. Negative exposure increases from left to right. Point A is the exposure that produced the first excellent print, which is the minimum useful negative exposure necessary to produce a print judged to have “excellent” quality. As the negative exposure increases print quality rises and then basically levels off.

This is an important point, because the purpose of the First Excellent Print test is not about placing the exposure at the minimum useful point of exposure. It's about determing the lower usable limits of the film curve. Once that limit is known, desired exposure placement can be determined.

The fractional gradient method is derived from the First Excellent Print test and it determines the minimum useful exposure to produce an excellent print. Contrary to how it is frequently mischaracterized, this is not the intended point of exposure and never was. The current ISO speed standard, which still uses the concept of the fractional gradient method to determine speed, places the shadow exposure approximately 1 1/3 stops above the fractional gradient point. The original standard placed it even higher. Anybody interpreting the print that represents the first excellent print as representing the exposure determined from the ISO standard is simply mistaken. Prints made from negatives exposure one or 1 ½ over the first excellent print will obviously be of higher quality. Too much additional exposure has detrimental effects on quality that overshadow the gains in the shadow gradient (graph in post #36).

The idea of giving a negative a little extra exposure is not a evolutionary or innovative idea. And it's definitely not a “modern” idea. It’s a basic fundamental concept. Jones obviously knew this as evidenced by the conclusions from the First Excellent Print test and how those conclusions were implemented and how they are still relevant today. Anyone who implies anything differently has either not read Jones’ papers, doesn’t understand them, or is purposely mistating the facts.

Page 441.jpg
 

Bill Burk

Subscriber
Joined
Feb 9, 2010
Messages
9,221
Format
4x5 Format
If I'm reading the graph correctly, Point Z is the highlight density of the "Just Acceptable" print. I'd love to see a specific example that defines this as the optimum point for shadow placement to substantiate the claim.

Hi Stephen,

I see the graph labeled Z marks the upper highlight of "just acceptable" print.

PE observed and for this extremely strange curve, Z also indicates the beginning of the straight line. For this crazy film, PE says that's the most excellent shadow placement. And based on the crazy graph, I think he's right. But this is a crazy graph where that point is more than 3 stops above the minimum exposure. It's just a bad example.

We should really get a better graph to discuss the beginning of the straight line because usually I find the best exposure to be.. not 3 stops overexposure... more like 2/3 stop overexposure.

The best part of this discussion for me is that it's making me realize the "first excellent print" is not necessarily the "most excellent print." Until now I held the Todd/Zakia position "The least, if it is enough, is usually the best".
 

Bill Burk

Subscriber
Joined
Feb 9, 2010
Messages
9,221
Format
4x5 Format
Now, it is clearly impossible to do all of this

I think that is funny but also heartbreaking. I would feel better if it was necessary to have extremely expensive test equipment to do the tests. For example if you had to use a carbon black glass wedge, I have never seen one for sale on eBay. Then everyone would have an excuse.

But for about the price of a single roll of film, anyone can buy a Stouffer scale. That tiny investment will immediately pay for itself because without a step wedge, you have to expose film more wastefully.
 
Joined
Jan 7, 2005
Messages
2,609
Location
Los Angeles
Format
4x5 Format
PE observed and for this extremely strange curve, Z also indicates the beginning of the straight line. For this crazy film, PE says that's the most excellent shadow placement. And based on the crazy graph, I think he's right. But this is a crazy graph where that point is more than 3 stops above the minimum exposure. It's just a bad example.

We should really get a better graph to discuss the beginning of the straight line because usually I find the best exposure to be.. not 3 stops overexposure... more like 2/3 stop overexposure.

Bill, it doesn't look much different than TXP 120. Besides, you shouldn't have to pick and choose examples to fit a rule or system, it has to work with all examples. Almost all systems work under average conditions. It's the outliers that make or break a system or rule.
 
Last edited by a moderator:
Joined
Jan 7, 2005
Messages
2,609
Location
Los Angeles
Format
4x5 Format
If I may interject with a question about Tri-X 320 and it's curve shape, I have never understood why it was designed that way.

Kodak says its curve (long toe, upswept thereafter) is well suited for tone reproduction under controlled lighting situations.

We also know when flare is present, the toe of a film is flattened, meaning under "uncontrolled" situations the low ends of the curves of shorter toe films (most current films) will tend directionally toward that of Tri-X 320. Most of us would call this effect undesirable. However since subject flare is beyond our control in the field there is nothing we can do about it other than perhaps give more exposure.

Yet Kodak designed this apparently undesirable toe shape into a film intended primarily for use under controlled and/or low flare conditions - precisely the conditions under which we might not otherwise have to settle for a flare-induced long toe. We could use Tri-X 400 under those controlled conditions, and retain its shorter toe and long straight line, but instead Kodak gives us a film that, under controlled conditions, "mimics" the effect flare has on the low end of the curve of a short toe film under uncontrolled conditions. In fact, depending on which developer is used, Tri-X 320 can be "all toe".

Does this not imply in Kodak's view, from a tone reproduction perspective the native toe of Tri-X 320 (or the flare-affected toe of a straight line film) is desirable? The emphasis in an unmanipulated print would be on strong mid-tone gradation relative to shadows (which seems to be what observers focused on in identifying first excellent prints).

Hi Michael. Good observation. With the higher flare for exterior scenes and lower flare for interior (controlled lighting), the effective shadow reproduction will be the same with Tri-X and TXP (or however they distinguish them these days). Think about what that says about long toed films used outside or short toed films used inside. There is an excellent explanation in Chapter 22 page 491 of The Theory of the Photographic Process. If I remember correctly, TXP and other such long toes curves were sometimes described as good for portraits. There are certain desirable traits specific to portraiture work. I'll have to go back and re-read that section.
 
Last edited by a moderator:

Photo Engineer

Subscriber
Joined
Apr 19, 2005
Messages
29,018
Location
Rochester, NY
Format
Multi Format
If you look at figure 20.5 in Mees, in the example supplied, you see that after the first acceptable print (point "A"), you will note that the caption then reads "Higher quality than first acceptable print". This is exactly the point that I have been trying to make. You get an acceptable print followed by even better and better prints until quality begins to decline as you run into the shoulder. It does NOT mean that the first acceptable print is the best that can be done. It is the print that is selected from a bundle of prints from over and under exposed negatives that "customers" call the first one they would accept!

This is the fundamental flaw in this entire discussion and one easily resolved while doing the test by actually asking the customer to start by setting aside clear rejects, and then setting aside the ones they think are the best from any given scene. One or two will remain as being the first acceptable print. They will test as being exposed for point "A".

Of course I cannot show any of these prints. If anyone ran the test and could show the test it would be Stephen. Mine are all the property of Eastman Kodak and those I had were turned in when I retired or when any of the others retired as well. I can say that I helped manage the tests and personally plotted curves and tabulated data. No theory here. So sitting in an armchair. This was stacks of prints up to 1 ft deep that had to be gone through or laid out for "customers".

Our customers were EK employees picked at random, or customers from photofinishers around the country who got the test and volunteered to cooperate in the process.

Now, as for the TX films, the one with the soft toe represents the curve of an older type film and the one with the sharp toe represents the newer type film.

I posted the aim curve of a modern film with a 0.6 gradient here before. If you wish, I will pick it out again and post it. However, I want you to know that it was for Kodacolor Gold 400 from the '80s, for the cyan record, or equivalently for any ISO 400 pan B&W film, as with proper exposure they produce the same neutral H&D curve. Even so, I use 1/3 stop over exposure for all of my B&W or C41 films, (Not 2/3 Bill) because that is enough and I don't risk running into the shoulder on some films with shorter latitude.

PE
 

RalphLambrecht

Subscriber
Joined
Sep 19, 2003
Messages
14,631
Location
K,Germany
Format
Medium Format
i knowwhat PE is talking about because I was shown theprints of threvtest by another retired Kodak engineer.PE is correct 'firstacceptzable'does not mean best but they were close.I made the 0.62gradient the target rendition gradient for mydigitalB&W printer calibration efforts.:smile::wink:
 
Joined
Jan 7, 2005
Messages
2,609
Location
Los Angeles
Format
4x5 Format
If you look at figure 20.5 in Mees, in the example supplied, you see that after the first acceptable print (point "A"), you will note that the caption then reads "Higher quality than first acceptable print". This is exactly the point that I have been trying to make. You get an acceptable print followed by even better and better prints until quality begins to decline as you run into the shoulder. It does NOT mean that the first acceptable print is the best that can be done. It is the print that is selected from a bundle of prints from over and under exposed negatives that "customers" call the first one they would accept!

Ron, this has been what I've been talking about for years. No one has proposed First Excellent Print produces the highest quality prints. If you are referring to the caption in Fig 20.5 "Higher quality than first excellent print," I did notice that. I wrote it.
 
Last edited by a moderator:
Joined
Jan 7, 2005
Messages
2,609
Location
Los Angeles
Format
4x5 Format
PE is correct 'firstacceptzable'does not mean best but they were close.

Of course it doesn't mean the best possible quality (Fig 20.5 in Post #66). The First Excellent Print and resulting fractional gradient method defines a limiting gradient. Has anybody read the paper? It was never been proposed to have exposure fall on the fractional gradient point. It's a point of measurement from which speed is determined, not where exposure will fall. Same thing as the current ISO standard. I've been making this distinction for years.

Jones found that it didn’t matter what the actual value of the minimum gradient was. It just had to be within a certain ratio of the average gradient. Photograph is psychophysical which means the technical must relate to the perceptual. Jones, “It should be emphasized that the exposure value corresponding to the point M is determined directly from the statistically chosen first excellent print and does not depend in any upon any sensitometric operation, but is a direct result of a psychophysical estimate of picture quality.” Speed methods before didn't take this into account. According to Berg in Exposure Theory and Practice, "With this criterion, we complete the circle which started from a purely academic linking of the speed with an almost entirely arbitrary property of the characteristic curve, then led us to the purely practical concept of speed, to end up with what appears to be the most successful attempt so far of connecting print quality with a characteristic of the negative material. Realizing that speed must be based on print qualtiy, Jones ..."

This brings up an interesting topic concerning the exclusively straight-line exposure concept. As the question of good exposure needs relate with perceived quality, with an exposure system based on exposing the negative on the straight line portion of the curve, what would be the limiting gradient? Or in other words, how much tolerance does it have? 100% of gamma? 90%? Is there a sudden drop-off in perceived quality or is it gradual? As with the First Excellent Print test, is the limiting gradient relative to the average gradient or perhaps just the straight-line gradient which would technically be Gamma. Common sense says it’s gradual, and if it’s gradual, the exposure wouldn't be limited to the straight-line. There must; therefore, be a limiting gradient.

Without first determining the limiting gradient, the straight-line method is no different than all the speed methods prior to Jones. It uses an "arbitrary property of the characteristic curve." Hurter and Driffield's inertia method was similar. They concluded that for luminance differences throughout the luminance scale of the object to be represented by proportional density differences in the negative, it is necessary that the exposures representing those luminances should fall upon the straight-line portion of the curve," Theory of the Photographic Process. Sounds reasonable, but Jones found the method to be far from satisfactory compared to the "print speeds" from the psychophysical testing.

Print vs inertia speeds.jpg
 
Last edited by a moderator:

Chris Livsey

Member
Joined
Aug 10, 2008
Messages
635
Format
Medium Format
I have thoroughly enjoyed this thread and thank all participants.
May I ask, and I know I could probably find this somewhere but it must be better to go primary sources, how finessed was/is the first excellent print?
I have been reading the Windisch surface developer thread as well, yes the weather is poor and I have no backlog to process, where some of the discussion centred around the necessity of formulae to be exact. Did 0.1g either way matter? The answer, as always in one of my specialist areas medicine information pharmacist, is: it depends. So in the first excellent print how far away was the not quite the first excellent print and the better by a bit than the first excellent print from that chosen? The corollary of course being if either of those had been chosen instead how much practical and theoretical, on speed, difference would ensue? Is it implied by PE giving a, and the term safety margin is contentious I know, an extra one third of stop that we are that close? If so I commend the process and am not surprised a large statistical sample was required to obtain a valid result.
 
Joined
Jan 7, 2005
Messages
2,609
Location
Los Angeles
Format
4x5 Format
So in the first excellent print how far away was the not quite the first excellent print and the better by a bit than the first excellent print from that chosen? The corollary of course being if either of those had been chosen instead how much practical and theoretical, on speed, difference would ensue? Is it implied by PE giving a, and the term safety margin is contentious I know, an extra one third of stop that we are that close? If so I commend the process and am not surprised a large statistical sample was required to obtain a valid result.

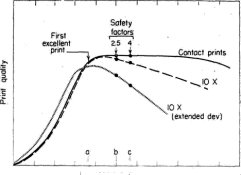
The answer is it depends. Such things are always nuanced and in need of qualification. Some of the graphs already presented in this thread can help answer your question. The exposure vs quality curve that ic-racer uploaded is one.

Exposure Quality Curve 1.jpg

It has the added factor of quality with degree of enlargement. This indicates that quality falls off faster for smaller format films with increased exposure because smaller format films require a larger degree of enlargement. The first excellent print exposure is shown just below the top of the curve. The two safety factors of 2.5 and 4 represent what the range of what the assumed safety factor was for the pre-1960 ASA speed standard. In Safety Factors in Camera Exposures, Nelson noted that is was "a remarkable fact that the exact size of the safety factor has not been definitely known." Flare played a factor. He later concludes the safety factor was 2.5. There is only one ISO speed method for all general purpose film formats. Something to consider when listening to exposure advice.

Here's an example of print judgement tests from the same paper showing the position of the first excellent print exposure and the metered exposure. Please note that the metered exposure represents the pre-1960 ASA standard that had speeds one stop slower than the post-1960 standard. In other words, it is one stop further to the right than a metered exposure today.

Exposure vs Quality - Safety Factor.jpg

Here is a copy of the same graph as from Fig. 20.5 in The Theory of the Photographic Process page example. It is from The Evaluation of Negative Film Speeds in Terms of Print Quality pt 1 by Loyd Jones which is the paper on the First Excellent Print test. I believe the exposures are at 1/2 stop intervals. According to Jones, "the print quality improves somewhat slowly for the first two or three prints (to the left of the point designated by B), then quite rapidly (to the point designated by A), after which the change in print quality is relatively small and somewhat uncertain in sign. In the region to the right of A there is considerable disagreement among observers as to whether the general tendency is somewhat upward or somewhat downward, or possibly oscillating about a horizontal line, as indicated by the solid curve."

first excellent print.jpg

The current ISO standard places the exposure at approximately 1 1/3 stops above the fractional gradient point. I say approximately because it assumes a certain amount of flare. It the flare factor is higher, the exposure will fall higher on the curve and if lower, it will fall closer to the fractional gradient point. If no flare existed, it would fall about 1/3 of a stop above it. This might sound right for people who understand ΔX is 0.296 Δlog-H from the fix density point of 0.10 over Fb+f in the ISO standard which should make a no flare exposure fall on the fractional gradient point. The extra 1/3 stop comes from the 0.80 speed constant in the speed equation. It increases exposure by 1/3 stop over where the speed point is measured.

This is a graph I put showing the ISO speed standard and its relationship to the fractional gradient point which can be determined using the Delta-X criterion.

ISO Speed Graph with Delta X equatioin.jpg

As mentioned before, film speeds were approximately one stop slower before 1960. Average flare was one stop higher. So exposures before 1960 with uncoated lenses could be 2 stops higher than today. People who use Zone System testing find EIs 1/2 to one stop higher than the ISO rating. This comes not from determining personal film speed but by a different method of testing. They are basically rating their film at the pre-1960 levels.

There is a lot of latitude in the over exposure side of negatives. More for larger formats than smaller. There isn't as much underexposure latitude. Rating the film an extra 1/3 stop in one sense is a good idea. In another, the influence of variations in metering and luminance range usually exceed such a small adjustment. Something usually not mentioned. Shadow placement is based on the average subject Luminance range of 2.20. This is the assumption of where the shadow will fall from the metered exposure (which is Δ1.0 log-H to the right of the 0.10 fix density point). If the luminance range is longer or shorter than the average, the shadows will fall on a different place on the curve.
 
Last edited by a moderator:

Chris Livsey

Member
Joined
Aug 10, 2008
Messages
635
Format
Medium Format
Stephen, Thank you for such a comprehensive reply, it is most helpful to have those graphs in one post. I agree that the one third of a shot bias is swamped in real life with the variables of any given scene, unless in a controlled studio environment. I did establish personal speeds in my Adams/Zone phase but as years have advanced I am now a sunny sixteen shooter. Rather than the rough estimate this implies I find that personal scene evaluation and knowledge of the lens/film/developer combination leads to more accurate exposure, be that an oxymoron, than any slavish reliance on a "dumb" meter although I do tend to carry a pocket one so I can argue with it!

Despite this empirical approach having this type of discussion adds to the knowledge base that subconsciously guides practice.
 

Photo Engineer

Subscriber
Joined
Apr 19, 2005
Messages
29,018
Location
Rochester, NY
Format
Multi Format
Ron, this has been what I've been talking about for years. No one has proposed First Excellent Print produces the highest quality prints. If you are referring to the caption in Fig 20.5 "Higher quality than first excellent print," I did notice that. I wrote it.

Since this particular figure dates from the '40s, and appears in Mees (2 editions), Mees and James, and in an altered form in Haist, I think that you must be pretty old by now! :D

PE
 

Photo Engineer

Subscriber
Joined
Apr 19, 2005
Messages
29,018
Location
Rochester, NY
Format
Multi Format
Now, we have been talking about the film, but remember that the printing process enters into the reproduction of an image. This process is the result of multiplying (dD/dLogE)paper * (dD/dLogE)film at any one point to get the curve of the print. Since all of these curves are considered cubic splines, they are difficult to express in a single equation, but the differential of the slopes can be used at any point.

Well, how does this help or hinder us?

First we must consider the fact that the eye perceives the world as a straight line (with extensions beyond the x and y axes due to the iris of the eye and the rhodopsin and its derivatives on the retina), and it accomplishes this perception by integrating all scenes, even prints that we make. But prints are not linear, they are curves as noted above and thus a print with a slope of 1.0, which might be considered as being satisfactory, is integrated by the eye to give a very low contrast and is considered unacceptable.

A print, to be acceptable to the eye, must have a mid scale slope of around 1.5 so that when integrated by the eye with the toe and shoulder, the overall image appears to have a slope of 1.0.

So, here is our equation: slope of film x slope of paper = slope of print and we have some definitions too.

Slope of film = 0.6, slope of paper = 2.5 and slope of print = 1.5. Does this work? .6 x 2.5 = 1.5 < yes it does and thus we see why prints look good if exposed above point "A" on the film. What happens if the toe of the film meets the shoulder of the paper? These are reproduced as shadows, while at the other end, the shoulder of the film and the toe of the paper reproduce highlights. At this point, the slope of the film is no longer 0.6 and the slope of the paper is no longer 2.5 and thus the slope of the print falls below 1.5 thus making the eye perceive the image as low in contrast, dull and lacking in detail. You can see this quickly by making a step wedge onto film and then printing that onto paper.

The point of this exercise is to prove why prints get better as you move up onto the straight line, and it is also why Kodak and other companies have tried to modernize the curves of all film products to maximize the straight line portion. In fact, it is so good that at this time, it is not necessary to overexpose negative films by 1/3 stop. Spot on is better!

PE
 
Photrio.com contains affiliate links to products. We may receive a commission for purchases made through these links.
To read our full affiliate disclosure statement please click Here.

PHOTRIO PARTNERS EQUALLY FUNDING OUR COMMUNITY:


Ilford ADOX Freestyle Photographic Stearman Press Weldon Color Lab Blue Moon Camera & Machine
Top Bottom