• Welcome to Photrio!
    Registration is fast and free. Join today to unlock search, see fewer ads, and access all forum features.
    Click here to sign up

Zone Placement

Chose vue

A
Chose vue

  • 0
  • 0
  • 26
Chose vue

A
Chose vue

  • 1
  • 0
  • 33

Recent Classifieds

Forum statistics

Threads
202,109
Messages
2,835,208
Members
101,119
Latest member
Photrizen
Recent bookmarks
0
OP
OP
Stephen Benskin
Joined
Jan 7, 2005
Messages
2,743
Location
Los Angeles
Format
4x5 Format
Dale, you've made a good logical argument but there are a few details that need to be included and they will lead to a different conclusion. If you go back to the beginning of this thread, one of the concepts was the correct interpretation of the data requires a proper understanding of the principles involved. With aim NDR, it was interpreting flare from the data in a non-flare test.

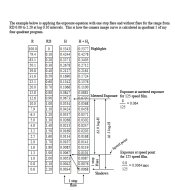
You're correct that the information that comes with the grey card recommends opening up 1/2 stop when metering the card outdoors. You are also correct that, given all the conditions of the standard model of exposure, 18% reflectance is 1/2 stop brighter than the metered exposure point of 12%.

What you left out was there is a distinction with using a grey card as a test target and using it to base the exposure upon. The exposure meter wants to make an exposure at the film plane of 8/ISO no matter what it is pointed at. It doesn't matter. Whether it's a 18% grey card, white card, or whatever, the metered exposure will fall at the same point on the curve. Meter an 18% grey card or a white card and stop down a stop and the exposure will fall 0.30 log-H units to the left of the metered exposure point. Therefore, the reflectance of the target card has no affect on the placement of exposure.

What is important is all the tones surrounding the reflectance of the object metered and where they will fall on the film curve in relation to the metered exposure.

The concept of exposure is to place the exposure values of the scene on the film curve where there is sufficient separation (gradient) to produce a quality print. This is why determining the minimum point of exposure (fractional gradient) where this can happen is a vital component in the determination of film speeds.

For an average scene, the shadows fall 4 1/3 stops below the meter exposure point. As we know, no matter the luminance of an object in a scene, the exposure meter will want to make it the same exposure value. The difference between shooting a card for a test and metering it to photograph a scene? The test card is by itself. The card used for photographing a scene has the scene attached with its range.

If you meter a white object and use the metered exposure, the white card will fall at 8/ISO. As most of the rest of the scene is darker, it will fall to the left of that point on the curve. We know that the fractional gradient point falls approximately 4 1/3 stops below the metered exposure point, so anything below that will have degraded quality.

The shadows in an average scene fall between 4 3/4 and 5 stops below 18% reflectance. In order to have the shadows fall at a point for good reproduction, the metered exposure must be adjusted by 1/2 stop. That's why you open up when metering an 18% grey card to photograph an outside scene.

The instructions that come with Kodak's Neutral Grey Card also say not to adjust the exposure when using the card to determine the exposure for a copy or 2 dimensional set-up. Why? It has nothing to do with mid-tone reproduction. It's because the blacks from art work don't fall as far down on the curve as the exterior scene's shadows.

Other than making sure there's sufficient separation of the shadows, there is no placing of tones on the negative. The negative is the intermediary step in the process. You just need to have a negative that separates all the luminance values from the scene and has a density range that closely matches the paper. The rest is misinterpretation on how it works.

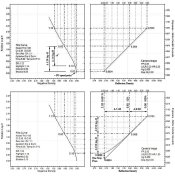
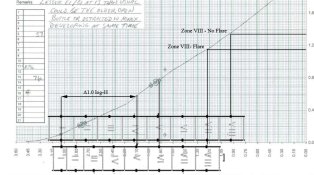
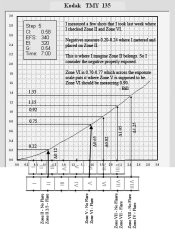
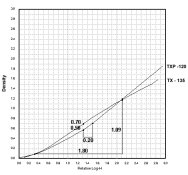
I've attached two fun examples. The film curve shows a long toed film (TXP 120) and a medium toed film (TX 135). They are processed to the same CI. The metered exposure point falls 1.0 log-H units to the right of 0.10 Fb+f. The two films have different densities at this point. It would take an additional 2/3 stop with the long toed film for the densities to match.

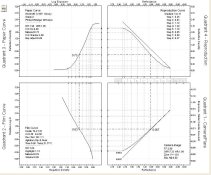
The four quadrant curve has the reflectance of Zone V equaling 12%. Because of the various factors of the film and paper curve shape, and the luminance range interact, it is possible to meter a 12% Zone V reflectance and have it print as a 18% reflectance. And this is with strict computer curve fitting. Sight differences in print exposure will easily shift the mid-tone around enough to concluded anything you want about Zonal relationships.
 

Attachments

  • TX and TXP comparison.jpg
    TX and TXP comparison.jpg
    149.9 KB · Views: 129
  • Zone V as 12% - 4 quad.jpg
    Zone V as 12% - 4 quad.jpg
    83.3 KB · Views: 140
Last edited by a moderator:
OP
OP
Stephen Benskin
Joined
Jan 7, 2005
Messages
2,743
Location
Los Angeles
Format
4x5 Format
I just found this little passage on page 95 of the fourth edition of Beyond the Zone System. Let me know if it sounds familiar.

"Now, because you will want to produce negatives that print comfortably on your chosen paper, use the SI value (read LER) you calculated in your paper test to locate IDmax, but do so only after making one further adjustment.

This final adjustment is necessary because your curve data are based on a no-flare test condition, but you'll be applying the data to camera exposures that invariably involve significant amounts of flare. We'll discuss flare in greater detail later, but at this point, you should realize that it general effect is to increase the negative's IDmin value and decrease it DR. In other words, it boosts the negative density and reduces contrast, especially shadow contrast. For example, if we assume an SI value of 0.90, your test data may indicate that a negative of some subject will have an IDmin value of 0.06 and an IDmax value of 0.96 (found by adding an SI of 0.90 to the IDmin), but camera flare will typically alter those values to something more like IDmin = 0.15, IDmax = 0.97, for an effective DR of perhaps 0.82."

Davis' solution?

"At this point, we can only guess at the amount of adjustment necessary, so we'll assume a typical value and make the compensation by increasing the SI (LER) value by 10%.

For example, if your SI (LER) value is 0.90, multiply it by 1.10 (110%) to get 0.99, and add that to 0.06(the IDmin value) to get 1.05. Then mark each curve at that level: 1.05 over B +F."

Davis has, in effect, done the same work around as the Zone System (NDR 1.25 example), except he made a conscious decision to do so by understanding the theory and the Zone System just lucked out. I, however, have the same problem with Davis approach as I do with the Zone System in that it doesn't explain what is really going on in reality. The paper's SI (I hate that he never update his terminology as well as just made some of it up) or LER, is what it is.

Attributing the influence of flare to the LER instead of the log-H range is conceptually wrong and misleading. It can create a problem with proper interpretation of the conditions and results, and it can be misleading when communicating the conditions and results with others. If I looked at someone's LER value and it read as 1.05, that tells me that between 0.04 above Pb+f and 90% paper D-max, the log exposure range of the paper was 1.05 and a negative with a density range of 1.05 will fit that paper nicely. Did doesn't tell me that the value was adjusted for flare. So, either I'm going to misinterpret the data or someone is going to have to include caveats along with the data. This is a problem I have with all systems. That's why I like to keep it as close to pure tone reproduction theory as possible.

Show of hands, how many people knew this was supposed to be part of the data when looking at BTZS testing results? How many people incorporate this factor into their BTZS testing?
 

Bill Burk

Subscriber
Allowing Ads
Joined
Feb 9, 2010
Messages
9,483
Format
4x5 Format
Well there is that chapter on making a black hole for flare testing, so I knew BTZS tested for flare.

Whether he put it on the negative instead of in the camera quadrant where it belongs, that is a tricky question. Does flare belong on the camera, where it occurs - or on the film, where its effect becomes measurable?
 

ic-racer

Member
Joined
Feb 25, 2007
Messages
16,752
Location
USA
Format
Multi Format
Are you referring to the testing method used in the First Excellent Print Test? The flare came when making the master transparencies.

So, presuming they are measuring the light intensity and range of the slide and the copy camera has no flare, it is essentially a no-flare setup. There is no link to any 'real scene' meter measurement, right? In that case their results (0.3 G) and the following standards based on those results (ASA and ISO) would primarily be valid only for film-plane exposure metering, right? Or is flare factored in somewhere in ISO or ASA?
 
OP
OP
Stephen Benskin
Joined
Jan 7, 2005
Messages
2,743
Location
Los Angeles
Format
4x5 Format
Or is flare factored in somewhere in ISO or ASA?

Absolutely! This is what I've been talking about. It's in the difference between the metered exposure, the speed point, and the shadow exposure. 0.10 Fb+b speed point is 1.0 log-H units below the metered exposure (Hg/Hm). The average shadow falls 1.3 log-H units below. Flare is what brings the shadows up around the speed point.

Film speed would be a stop slower without flare, or a ~ stop slower EI if the technique doesn't account for it (Zone System).

The fractional gradient point for the ISO contrast parameters falls just about a stop below the 0.10 Fb+f speed point. This means that there is a one stop safety factor to account for variations in camera exposure, but also variations in flare.
 

Attachments

  • k1 example.jpg
    k1 example.jpg
    247.1 KB · Views: 122
OP
OP
Stephen Benskin
Joined
Jan 7, 2005
Messages
2,743
Location
Los Angeles
Format
4x5 Format
Well there is that chapter on making a black hole for flare testing, so I knew BTZS tested for flare.

Bill, it's not about whether BTZS recognizes the influence of flare. Davis' statement supports what I've been saying about the importance of incorporating the influence of flare into the interpretation of the data from a no flare test, and how it works with the negative density range and contrast determination (like with the Zone System).

My feeling is that from the almost off hand and generalized way he presents the concept in the book, it probably doesn't register with very many of his readers. I know this is the first time I can remember really noticing it.
 

Bill Burk

Subscriber
Allowing Ads
Joined
Feb 9, 2010
Messages
9,483
Format
4x5 Format
I measured a few shots that I took last week where I checked Zone II and Zone VI.

Negatives measure 0.20-0.24 where I metered and placed on Zone II.

This is where I imagine Zone II belongs. So I consider the negative properly exposed.

Zone VI is 0.70-0.77 which across the exposure scale puts it where Zone V is supposed to be. Zone VI should be measuring 0.90.

I used EI 200 on the meter for TMY-2 (film developed to 320 at CI 0.58).

I am curious why my Zones landed where they did.

If flare allegedly gives a stop in the shadows. Why did I have to rate the film in half to place Zone II where it belongs? This is an open-ended question because I can always take more shots and note the meter readings and check where they land on film...
 
OP
OP
Stephen Benskin
Joined
Jan 7, 2005
Messages
2,743
Location
Los Angeles
Format
4x5 Format
Updated. I hope this is a cleaner example. I used one of my TMY 0.58 curves which matches up closely with Bill's curve.

This example fits in nicely with the discrepancy in the Zone System negative density range question that started this thread.
 

Attachments

  • TMY flare and no flare comparison.jpg
    TMY flare and no flare comparison.jpg
    226.9 KB · Views: 135

ic-racer

Member
Joined
Feb 25, 2007
Messages
16,752
Location
USA
Format
Multi Format
Absolutely! This is what I've been talking about. It's in the difference between the metered exposure, the speed point, and the shadow exposure. 0.10 Fb+b speed point is 1.0 log-H units below the metered exposure (Hg/Hm). The average shadow falls 1.3 log-H units below. Flare is what brings the shadows up around the speed point.

Film speed would be a stop slower without flare, or a ~ stop slower EI if the technique doesn't account for it (Zone System).

The fractional gradient point for the ISO contrast parameters falls just about a stop below the 0.10 Fb+f speed point. This means that there is a one stop safety factor to account for variations in camera exposure, but also variations in flare.

Ok that makes sense if we understand the flare as making the system slower, right?

But I thought you were trying to show otherwise.

In fact, I recall in a previous thread I had taken the argument that flare makes the system slower and was contrasting that against the view that the flare increased the speed of the system.

Something is still not clear to me.
 
OP
OP
Stephen Benskin
Joined
Jan 7, 2005
Messages
2,743
Location
Los Angeles
Format
4x5 Format
Are you thinking that because the shadow falls further to the left without flare, it means it is faster. If that is the case, then you are confusing how much exposure it takes to produce a certain density with where the exposure falls. When comparing two films, one film produces 0.10 density with X exposure. The other film produces 0.10 density with 1/2 X exposure. As the second film produced the same density with 1/2 the exposure, the film is twice as fast.

If we are talking about shadow placement, then that's just about where the exposure falls. 1/2 less exposure is just 1/2 less exposure, and it falls .30 log-H units further to the left on the curve. With flare, you have the 1/2X exposure plus a 1/2X amount of exposure coming from flare creating a shadow exposure of not 1/2X but a shadow of X exposure. This moves the effective exposure of the shadow 0.30 log-H units to the right on the curve.

You can also think of flare as reducing the log-H range from the metered exposure to the shadow. Instead of having 4 1/3 stops below the metered exposure, there are only 3 1/3 stops. The illuminance range is shorter and the shadows don't reach as far down the curve.
 

Attachments

  • Exposure Values.jpg
    Exposure Values.jpg
    180 KB · Views: 100
Last edited by a moderator:

Bill Burk

Subscriber
Allowing Ads
Joined
Feb 9, 2010
Messages
9,483
Format
4x5 Format
Bill, quick and dirty and in a word - flare.

Thanks Stephen these placements are starting to make some sense.

If my guess is right, quick and dirty accounting for flare - set EI on meter to half box speed.
 
OP
OP
Stephen Benskin
Joined
Jan 7, 2005
Messages
2,743
Location
Los Angeles
Format
4x5 Format
I added a few things to the last example. I don't know if helps or not.
 

Attachments

  • Exposure Values.jpg
    Exposure Values.jpg
    198.3 KB · Views: 104
Last edited by a moderator:

Bill Burk

Subscriber
Allowing Ads
Joined
Feb 9, 2010
Messages
9,483
Format
4x5 Format
It helps, so for one stop of flare you add .0034 to each corresponding value of H.

Because the scale is logarithmic, once you go up a stop or so, the added exposure becomes negligible.
 

paul ron

Member
Allowing Ads
Joined
Jan 22, 2004
Messages
2,709
Location
NYC
Format
Medium Format
Just curious, I like show n tells. I've been watching this thread since the begining n getting a real education but...

How about scannning negs or prints n show us what the differences you found in your experiments n how all this correlates in real life compared to the graphs n charts?

.
 
OP
OP
Stephen Benskin
Joined
Jan 7, 2005
Messages
2,743
Location
Los Angeles
Format
4x5 Format
Bill, that's right, although the 0.0034 is for 125 speed film. Flare factors are calculated in the shadow. A one stop flare factor is double the exposure of the shadow exposure. That value is then added to every point along the exposure range. By the time it hits the metered exposure point it only adds up to an extra 3%. i like to use a no flare curve in Quadrant 1 as a reference. You can see for average flare, the two curves practically merge after the mid-point.

Are you beginning to see what I'm saying about the importance of incorporating the influence of flare into a no flare test when interpreting the data? What's really helped me to understand it is separating camera exposure from sensitometric exposure with the film curve and giving it a curve of its own with the camera image/flare curve.
 

Bill Burk

Subscriber
Allowing Ads
Joined
Feb 9, 2010
Messages
9,483
Format
4x5 Format
Hi paul ron,

I'll post pictures in the galleries when I get them printed. I don't have (or want) a 4x5 scanner. Basically, it was opening day of soccer season. The teams paraded by with the coaches holding their banners. It was midday, sunny. All shots are f/8 at 1/300. I spotmetered the black shorts and the kids faces.

Whenever I checked the shorts and faces, I always got the same reading on the meter, so the lighting was stable. But because the scenery was dynamic, it is fair to ask... did my Zone placement move on me? (Maybe in reality at the moment of the shot, the faces were actually Zone V). I'm wondering that myself as some highlighted cheeks do measure over 1.00
 
OP
OP
Stephen Benskin
Joined
Jan 7, 2005
Messages
2,743
Location
Los Angeles
Format
4x5 Format
Most people are familiar with the story behind Ansel Adam's Moonrise Over Hernandez. It is arguably considered his best work. It was very underexposed. The beautiful prints he was able to create are a more a testament to his skill as a printer and his eye as an artist than to his exposure technique.
 

markbarendt

Member
Allowing Ads
Joined
May 18, 2008
Messages
9,422
Location
Beaverton, OR
Format
Multi Format
The fractional gradient point for the ISO contrast parameters falls just about a stop below the 0.10 Fb+f speed point. This means that there is a one stop safety factor to account for variations in camera exposure, but also variations in flare.

Most people are familiar with the story behind Ansel Adam's Moonrise Over Hernandez. It is arguably considered his best work. It was very underexposed. The beautiful prints he was able to create are a more a testament to his skill as a printer and his eye as an artist than to his exposure technique.

Part of what I find truly special about using negative film is the flexibility and the "built in" safety factors.
 
Photrio.com contains affiliate links to products. We may receive a commission for purchases made through these links.
To read our full affiliate disclosure statement please click Here.

PHOTRIO PARTNERS EQUALLY FUNDING OUR COMMUNITY:


Ilford ADOX Freestyle Photographic Stearman Press Weldon Color Lab Blue Moon Camera & Machine
Top Bottom