Here's another random observation...
I have a selenium cell incident meter, an old Sekonic.
Without the white dome, the meter reads three stops higher than with the white dome.
So even though the dome is colored white...
It's cutting about three stops and the meter cell sees gray.
And thus the reason for the Incident meter's constant "C."
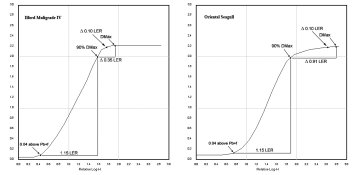
Bill, you should keep in mind that average gradient and how it corresponds to development indication, N, N+1, etc, is reliant upon the enlarger light source and the test parameters of the paper. For an average gradient of 0.50 to equal -1, it has to be based on a diffusion enlarger and normal being 7 1/3 stops with the paper LER being tested using the standard method. The reason why RonC can fit a ten stop range onto a grade two paper with only -1 processing is because his test utilizes the full range of the paper. Normally, if someone had a ten stop range and wanted it to fit in within the 0.04 and 90% Dmax, the gradient would have to be around 0.43. There's a technical reason why 0.04 above Pb+f and 90% of Dmax was chosen, but the following example of two paper curves with the same LER is a good illustration of one of them. Notice the difference in log-H between 90% of Dmax and Dmax.

Let's take a look at what the LER from a full paper range would look like. Conservatively, let's say we add 0.20 from both ends to the 1.15 LER for 1.55. What would the aim CI be for a ten stop range?
1.55 / 3 = 0.517. With flare 1.55 / (3-.30) = 0.574.
The 0.517 is close to what RonC is getting and the 0.574 proves what I was saying about accent black and specular highlights.
Last edited by a moderator:


