Plotting the x and y axis of the H&D curve as logarithm allows one to understand and manipulate the data with addition and subtraction.
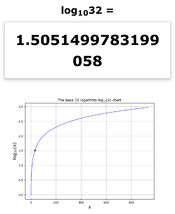
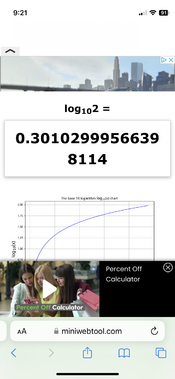
Each stop is 0.3 log, so you can use simple math to find out distances on each axis in stops.
Otherwise one would encounter problems like determining the number of stops between,say 30,456 and 417, etc…
But not without some confusion, where negative numbers on the axes can have one scratching their head over negative values of light, when indeed it is merely a representation of light values less than one.
Last edited:


