The Kodak T-MAX P3200 and Ilford Delta 3200 are highly popular and highly respected panchromatic films with high speed, respectably small grain, and beautiful tonality. I thought perhaps we could discuss their performance in this thread. I am going to perform a few different tests along the way and report my results once they become available. I hope you guys will offer your own comments and suggestions of what and how else to test these two films.
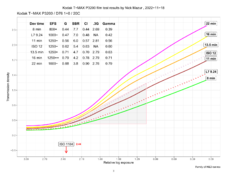
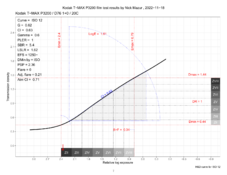
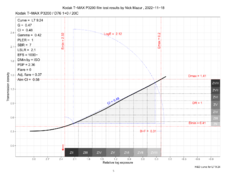
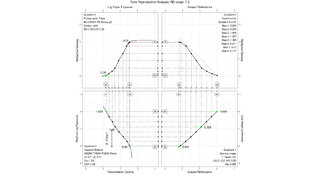
to start with, I ran a conventional curve-family test of both films, giving them the same exposure and processing them in the same tank. I ran the full test twice, each time obtaining very similar results. I then averaged density readings over the two trials. There is a lot of data to go through, so I am going to present it in small chunks, staring with a summary and curve family plots for each film. There's a lot more detail coming, hopefully, as the thread continues. At the end of my analysis, I will publish a detailed report.
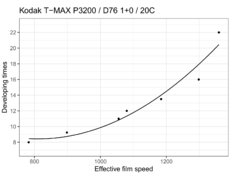
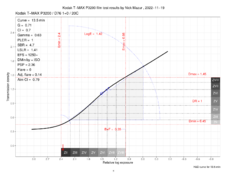
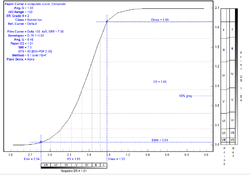
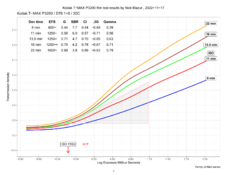
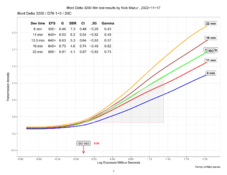
The Kodak curves turned out a bit lumpy. I used two different rolls (both fresh), coming from two different mail orders to make sure I did not accidentally end up with a defective product. In each case, the curves ended up looking somewhat lumpy, especially compared to the well-formed Ilford curves. The two films have a different response to exposure and development. Kodak has a long toe and nicely controlled mid-tone and highlight contrast, as the development time increases. The film actually gains a bit of speed (shadow detail) over the range of processing times, of almost a whole stop, whereas Delta 3200 produces virtually no gain in speed, only in contrast. Bear in mind that I used D76, so the results would probably be different with DDX and XTOL. I am planning to use XTOL to push-process these films in the near future. Oh, and you will also notice that the Kodak film has a higher B+F density, at least with D76.
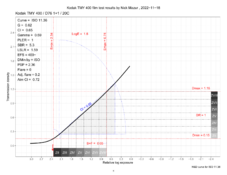
I plotted the curves using absolute log exposure values and calculating ISO film speed based on them. There's a summary table included with each plot. I must emphasize that I used an uncalibrated, DIY sensitometer, so the results are meant to be rough, "ballpark" estimates, only. I do have a calibrated and certified sensitometer, but decided to use the same exact setup as I did for my recent test of the CatLABS film, just to keep it consistent. I gave the films an exposure of around 2.24 MLS, which I estimated to be approximately what's needed for an ISO 1000 film. Again, there's a lot more detail coming soon.


