Testing and evaluating KODAK T-MAX P3200 and Ilford Delta 3200

On The Mound

A
On The Mound

  • 0
  • 1
  • 31
What's Shakin'?

A
What's Shakin'?

  • 4
  • 0
  • 39
Bamboo Tunnel

A
Bamboo Tunnel

  • 11
  • 5
  • 95
On The Mound

A
On The Mound

  • 3
  • 2
  • 86

Recent Classifieds

Forum statistics

Threads
198,453
Messages
2,775,445
Members
99,622
Latest member
ebk95
Recent bookmarks
2
OP
OP
aparat

aparat

Member
Joined
Sep 5, 2007
Messages
1,177
Location
Saint Paul,
Format
35mm
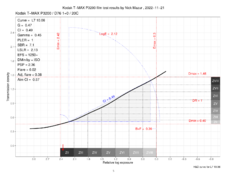
@Stephen Benskin Thank you for the "What is Normal" article. I have previously implemented flare-adjusted CI from the Kodak table, I also implemented the variable flare-adjusted CI that is consistent, I think, with your paper. Here's a theoretical curve for the KODAK T-MAX P3200 with the LSLR of 2.13. I think you recommend using the value of 2.2. Mine comes from the "standard" seven-stop range that the BTZS system considers normal. It's not a huge difference. The "Aim CI" is flare-adjusted and is estimated at around 0.58, which I also think is consistent with your paper, isn't it?
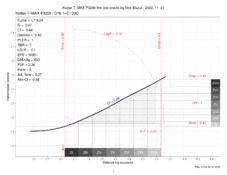
kodakTmaxP3200_CombinedPlotsrelativeDescendingFinalCI.png

I also wanted to ask your opinion on recalculating the film curves to include the effect of flare on negative density. The effect is going to be most pronounced in the shadows, and the correction does change the calculated parameters somewhat. From what I've read, this is not the orthodox way of doing it, but I did it, mainly because of BTZS. It's essentially an implementation of the "flare density" model from Phil Davis' book.
kodakTmaxP3200_CombinedPlotsrelativeDescendingFinalFlare.png
 
OP
OP
aparat

aparat

Member
Joined
Sep 5, 2007
Messages
1,177
Location
Saint Paul,
Format
35mm
I am still somewhat puzzled by the performance of Ilford Delta 3200, especially compared to T-MAX P3200. The KODAK film shows an actual speed increase over the range of processing times of about a stop. That's impressive. Ilford, on the other hand, shows a remarkable lack of any measurable increase in speed (shadow detail). There's an predictable increase in contrast, but that's about it. Is this consistent with what you guys found in your own darkrooms? Would you say that the effect would be different with DDX?

ilfordDelta3200_CombinedPlotsrelativeDescendingFinalIlfordCurves.png
 
Joined
Jan 7, 2005
Messages
2,609
Location
Los Angeles
Format
4x5 Format
@Stephen Benskin Thank you for the "What is Normal" article. I have previously implemented flare-adjusted CI from the Kodak table, I also implemented the variable flare-adjusted CI that is consistent, I think, with your paper. Here's a theoretical curve for the KODAK T-MAX P3200 with the LSLR of 2.13. I think you recommend using the value of 2.2. Mine comes from the "standard" seven-stop range that the BTZS system considers normal. It's not a huge difference. The "Aim CI" is flare-adjusted and is estimated at around 0.58, which I also think is consistent with your paper, isn't it?

View attachment 322372

I also wanted to ask your opinion on recalculating the film curves to include the effect of flare on negative density. The effect is going to be most pronounced in the shadows, and the correction does change the calculated parameters somewhat. From what I've read, this is not the orthodox way of doing it, but I did it, mainly because of BTZS. It's essentially an implementation of the "flare density" model from Phil Davis' book.

View attachment 322374

2.20 is the statistically average luminance range determined by Jones. As with most things, close enough in practice but a problem when you are doing theory. The aim CI for 0.58 is basically Normal. I like to think the most important part of the paper is how to determine the aims for the pluses and minuses. There's the different average flare for different luminance ranges and the desired aims for shorter and longer luminance ranges. There's a table showing the different CIs resulting from the various variables.

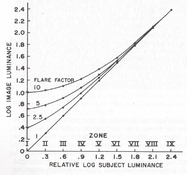
Adding flare to the film density comes from the days of hand drawing curves. It's easy to take a French curve to the toe and redrawn the curve to account for flare. My problem with that is it's not how flare works. Flare reduces the luminance range so the shadows fall further to the right on the curve. A flare factor of means the Illuminance range for a
7 stop luminance range is 6 stops at the film plane.
 

albada

Subscriber
Joined
Apr 10, 2008
Messages
2,172
Location
Escondido, C
Format
35mm RF
My print quadrant does incorporate flare. Since the paper tests use the enlarger I plan to print with, I don't contact the step tablet but enlarge it and allow some clear area around the tablet to introduce flare.

Good idea. When creating paper-curves, I've been contact-printing my tablet, thus adding no flare.

Elsewhere, you mentioned that AA does not compensate for in-camera flare though he uses a camera. I was thinking that an easy way to add such flare would be to photograph a tablet taped to a large 18% gray surface, thus simulating a typical scene of 18% reflectance. That surface would need to extend well beyond the camera's frame because light from outside the frame contributes to flare. Do you think this approach would work? If so, the same approach could be used when enlarging a tablet by placing the strip of paper on an 18% gray card.
 
OP
OP
aparat

aparat

Member
Joined
Sep 5, 2007
Messages
1,177
Location
Saint Paul,
Format
35mm
2.20 is the statistically average luminance range determined by Jones. As with most things, close enough in practice but a problem when you are doing theory. The aim CI for 0.58 is basically Normal. I like to think the most important part of the paper is how to determine the aims for the pluses and minuses. There's the different average flare for different luminance ranges and the desired aims for shorter and longer luminance ranges. There's a table showing the different CIs resulting from the various variables.
Is this what you mean?
adjusted_flare.png

Adding flare to the film density comes from the days of hand drawing curves. It's easy to take a French curve to the toe and redrawn the curve to account for flare. My problem with that is it's not how flare works. Flare reduces the luminance range so the shadows fall further to the right on the curve. A flare factor of means the Illuminance range for a
7 stop luminance range is 6 stops at the film plane.

Yeah, I agree, though I didn't know about the French curve history of it. I have implemented flare adjustment as changing the relationship between subject luminance and image luminance, based on the work of Jones and Condit, Henry, and others. I also used your paper on variable flare, which I found very insightful.

flare by Richard J Henry.jpg

But the "flare density" model by Phil Davis is mostly about recalibrating the film curve by primarily increasing shadow density, which may result in some increase in what BTZS calls "Subject Brightness Range" and Effective Film Speed. In principle I agree with you, but I also wanted to include the Davis model for photographers who are familiar with it.
flare by Phil Davis.jpg
 
Joined
Jan 7, 2005
Messages
2,609
Location
Los Angeles
Format
4x5 Format
Is this what you mean?
View attachment 322426


Yeah, I agree, though I didn't know about the French curve history of it. I have implemented flare adjustment as changing the relationship between subject luminance and image luminance, based on the work of Jones and Condit, Henry, and others. I also used your paper on variable flare, which I found very insightful.

View attachment 322427

But the "flare density" model by Phil Davis is mostly about recalibrating the film curve by primarily increasing shadow density, which may result in some increase in what BTZS calls "Subject Brightness Range" and Effective Film Speed. In principle I agree with you, but I also wanted to include the Davis model for photographers who are familiar with it.
View attachment 322428

I need to take a closer look at your flare table. The general rule is flare increase with an increase of the luminance range and decreases as the luminance range decreases. The average is a 0.10 increase in flare with every 0.30 increase in luminance range over the average 2.20. Here is the comparison table from the paper.

1669064396588.png


With adjusting the flare to the film curve, one stop flare is basically the density of the curve 0.30 log-H to the right of the shadow exposure. Two stops is the density 0.60 log-H and so on. You can get an impression using (I believe) the curve family from Henry's book.
 
OP
OP
aparat

aparat

Member
Joined
Sep 5, 2007
Messages
1,177
Location
Saint Paul,
Format
35mm
I need to take a closer look at your flare table. The general rule is flare increase with an increase of the luminance range and decreases as the luminance range decreases. The average is a 0.10 increase in flare with every 0.30 increase in luminance range over the average 2.20. Here is the comparison table from the paper.

With adjusting the flare to the film curve, one stop flare is basically the density of the curve 0.30 log-H to the right of the shadow exposure. Two stops is the density 0.60 log-H and so on. You can get an impression using (I believe) the curve family from Henry's book.
So I went back to my code. I wrote the flare function a long time ago. It turns out, I had implemented the variable flare model and the fixed flare model. I also added the "practical" flare model from your paper. Here's command line output for the "normal" LSLR table and for the KODAK T-MAX P3200 LSLR data, with the flare factor of 0.4. Trying to keep the discussion relevant to the thread :smile:
normal_flare.png


KODAK T-MAX P3200
p3200_flare.png


As far as N-numbers are concerned, I have implemented both the BTZS method and a very similar method to what is in your "What is Normal?" paper, with the BTZS being the default option. Please, don't hate me for it :smile:.
 
OP
OP
aparat

aparat

Member
Joined
Sep 5, 2007
Messages
1,177
Location
Saint Paul,
Format
35mm
I looked over his support files, and saw no article about testing papers. Could you provide the complete URL?

Yes, it's kind of buried in a PDF document. It's the manual of the Precision Enlarging Meter. The direct link to the PDF is here. If you don't use staining developers, you can ignore the section of the document dedicated to it. The meter is very good, and economically priced. You can even use it in place of a bench densitometer. The advantage is that you can measure densities of very small areas, even in 35 mm negatives.

You can use any enlarging meter, as long as it's accurate enough for your needs.
You can also download the worksheet for testing paper.
 
Joined
Jan 7, 2005
Messages
2,609
Location
Los Angeles
Format
4x5 Format
Good idea. When creating paper-curves, I've been contact-printing my tablet, thus adding no flare.

Elsewhere, you mentioned that AA does not compensate for in-camera flare though he uses a camera. I was thinking that an easy way to add such flare would be to photograph a tablet taped to a large 18% gray surface, thus simulating a typical scene of 18% reflectance. That surface would need to extend well beyond the camera's frame because light from outside the frame contributes to flare. Do you think this approach would work? If so, the same approach could be used when enlarging a tablet by placing the strip of paper on an 18% gray card.

From my perspective, a film test should be testing how the film responds to exposure and development to accurately depict the characteristics of the film. Flare or other variables related to shooting conditions can be "added" to the data interpretation afterwards. That's the beauty of a camera image quadrant. The problem with Zone System testing isn't that it is without flare, but that the interpretation of the data doesn't factor in flare. Possibly because there is an assumption of flare in the test.

Paper testing is a different situation. Printing conditions tend to be more consistent and controllable (enlarger, walls, etc).
 

DREW WILEY

Member
Joined
Jul 14, 2011
Messages
13,871
Format
8x10 Format
Stated simply, Delta 3200 has an exceptionally long toe to its characteristic curve. That allows "something" to be captured way down there in the shadows when shooting higher than ideal speeds for this film, like the marketed speed of 3200, which is over-optimistic but salvageable at least. Using longer development in relation to those faster speeds is necessary to build up decent overall printing density in the negative, as well as a little better shadow tonality separation.

I have a couple of very high quality enlarging meters - one actually a precision easel densitometer, plus a regular densitometer. But I don't bother with any of them when it comes to the common sense observation I just posted above. Gosh, people can sure can overthink and overcomplicate simple problems.

And bringing in an alternate usage of the term "flare" for lens flare itself, or lack of a sun shade, or bellows flare, is a recipe for confusing people. True film flare occurs when there is a lack of an anti-halation coating, a rather rare kind of film.
 
Last edited:

albada

Subscriber
Joined
Apr 10, 2008
Messages
2,172
Location
Escondido, C
Format
35mm RF
Yes, it's kind of buried in a PDF document. It's the manual of the Precision Enlarging Meter. The direct link to the PDF is here. If you don't use staining developers, you can ignore the section of the document dedicated to it. The meter is very good, and economically priced. You can even use it in place of a bench densitometer. The advantage is that you can measure densities of very small areas, even in 35 mm negatives.

You can use any enlarging meter, as long as it's accurate enough for your needs.
You can also download the worksheet for testing paper.

Got it. Thanks. I see that Nicholas Lindan recommends projecting (not contacting) a wedge onto the paper, which is the method @Stephen Benskin uses in order to accommodate flare.

@aparat, funny you should mention the Precision Enlarging Meter made by DarkroomAutomation.com. I have one. And I've used it for transmission density measures. In fact, I built an attachment for it that turns it into a reflection densitometer. Here's my posting about that, which has some pictures of it:

Accurate Densitometer for $120 with DIY Part

I have two Stouffer strips and four densitometers:
  1. An old Tobias that became flakey,
  2. Tobias TCX,
  3. DarkroomAutomation Precision Enlarging Meter (plus DIY attachment),
  4. Printalyzer Densitometer
I'm thinking of getting back into creating new developers, which will require extensive testing, measuring, and graphing, so this discussion about evaluation of films is important to me.

@DREW WILEY , don't get me started about bad terminology! A serious example is "zone". By definition, a zone is an area/region/sector, but AA uses it to refer to a point -- one specific value, as in "I'll place this spotmeter reading on zone III." You can't place a luminance on an area; you place it on a print-value. Better yet, you "render a luminance as a value." "Value" is a better term; Munsell got that right. "Zone system" should be "value system".
 
OP
OP
aparat

aparat

Member
Joined
Sep 5, 2007
Messages
1,177
Location
Saint Paul,
Format
35mm
Got it. Thanks. I see that Nicholas Lindan recommends projecting (not contacting) a wedge onto the paper, which is the method @Stephen Benskin uses in order to accommodate flare.

@aparat, funny you should mention the Precision Enlarging Meter made by DarkroomAutomation.com. I have one. And I've used it for transmission density measures. In fact, I built an attachment for it that turns it into a reflection densitometer. Here's my posting about that, which has some pictures of it:

Accurate Densitometer for $120 with DIY Part

I have two Stouffer strips and four densitometers:
  1. An old Tobias that became flakey,
  2. Tobias TCX,
  3. DarkroomAutomation Precision Enlarging Meter (plus DIY attachment),
  4. Printalyzer Densitometer
This is awesome! I am going to conclude that we think alike :smile:. I love that Precision Enlarging Meter. It's simple, but effective. I also "bought into" Darkroom Automation's methods for determining basic exposure, dodging, burning, etc. He created a great little system for getting work done. Of course, it doesn't take away anything from one's creativity. It just simplifies things.
I'm thinking of getting back into creating new developers, which will require extensive testing, measuring, and graphing, so this discussion about evaluation of films is important to me.
Cool. I am really glad to hear it. I have only rudimentary experience with non-standard developers, so I'll keep an eye out for your posts.
@DREW WILEY , don't get me started about bad terminology! A serious example is "zone". By definition, a zone is an area/region/sector, but AA uses it to refer to a point -- one specific value, as in "I'll place this spotmeter reading on zone III." You can't place a luminance on an area; you place it on a print-value. Better yet, you "render a luminance as a value." "Value" is a better term; Munsell got that right. "Zone system" should be "value system".
I couldn't agree more. The Zone System can be very opinionated, even dogmatic, if taken too seriously or literally. It's a method, some might even call it a framework, and it has its uses. I certainly learned from Ansel's books, but there's more to film photography than that.
 

DREW WILEY

Member
Joined
Jul 14, 2011
Messages
13,871
Format
8x10 Format
The Zone System has its own jargon, depending on which specific Guru you're reading. Terms like tone, tint, and value mean something different in standardized color mapping theory - which is the basis for all computerized color applications today - than in arbitrary black and white photography zone lingo. I don't think Minor White's distinct resemblance to the crazed professor in the movie, Back to the Future, is coincidental at all. And it helps to have a degree in Medieval alchemy and witchcraft too.

I think learning certain elements of the Zone System can be quite helpful to numerous beginners, as well as providing a sort of common-denominator dialect to many of us. But it can also become an unnecessary straightjacket if over-emphasized and taken as authoritative.
 
Last edited:
OP
OP
aparat

aparat

Member
Joined
Sep 5, 2007
Messages
1,177
Location
Saint Paul,
Format
35mm
Stated simply, Delta 3200 has an exceptionally long toe to its characteristic curve. That allows "something" to be captured way down there in the shadows when shooting higher than ideal speeds for this film, like the marketed speed of 3200, which is over-optimistic but salvageable at least. Using longer development in relation to those faster speeds is necessary to build up decent overall printing density in the negative, as well as a little better shadow tonality separation.

I have a couple of very high quality enlarging meters - one actually a precision easel densitometer, plus a regular densitometer. But I don't bother with any of them when it comes to the common sense observation I just posted above. Gosh, people can sure can overthink and overcomplicate simple problems.

And bringing in an alternate usage of the term "flare" for lens flare itself, or lack of a sun shade, or bellows flare, is a recipe for confusing people. True film flare occurs when there is a lack of an anti-halation coating, a rather rare kind of film.

I would agree with your take on Delta 3200. I have very fond memories, if you can call it that, from using the film. I have a few dozen negatives from around the time my son was born. The grain and tonality make these old pictures look special, at least to me. I also agree that I take film testing too seriously at times :smile:. I certainly don't mean to suggest that there's some special value to film testing. It's just a tool, like any other in photography.
 

Helge

Member
Joined
Jun 27, 2018
Messages
3,938
Location
Denmark
Format
Medium Format
I would agree with your take on Delta 3200. I have very fond memories, if you can call it that, from using the film. I have a few dozen negatives from around the time my son was born. The grain and tonality make these old pictures look special, at least to me. I also agree that I take film testing too seriously at times :smile:. I certainly don't mean to suggest that there's some special value to film testing. It's just a tool, like any other in photography.

Anything is a tool really. Tools are the most important and defining aspect of humans. Putting “just” in front is underselling your work.

I always assumed D3200 was faster than TMZ. I was taught a thing or three here.

If the toe of the film is long but thin it might mean that preflashing or latensification will work. Never felt the need to try it with this film.
 
Joined
Jan 7, 2005
Messages
2,609
Location
Los Angeles
Format
4x5 Format
And bringing in an alternate usage of the term "flare" for lens flare itself, or lack of a sun shade, or bellows flare, is a recipe for confusing people. True film flare occurs when there is a lack of an anti-halation coating, a rather rare kind of film.

It might been non-specific and common usage. Alternative or wrongly used it was not. Camera flare is the most common term used. The Theory of the Photographic Process, 3rd edition uses that term. As does the standard for reflective exposure meters. I have another standard about the measurement of veiling flare. Lens flare and optical flare are also used. Flare is also used when referring to halation. According to the Encyclopedia of Photography, 3rd edition, flare is defined as "Non-image forming light in a camera or other optical system due to the reflection of light from any of a variety of surfaces, such as those of the lens, the lens mount, and the interior of a camera or enlarger. When the flare is uniform over the image area, it produces a reduction of image contrast and an increase in image illumination and exposure." - L. Stroebel.

N.C. Nelson in Safety Factors in Camera Exposures calls it camera flare light. Loyd Jones in The Brightness Scale of Exterior Scenes and the Computation of Correct Photographic Exposure (The paper that determined the statistically average Luminance range) writes, "The shortening of the image illumination scale as compared with that of the brightness scale of the object is due to the presence of nonimage forming light in the camera., this light being usually referred to as 'flare light' or 'Flare.'" In Photographic Materials and Process, by Stoebel, Compton, Current, and Zakia which was used as the first year text book at RIT, says, "This second source of light is referred to as flare light, or simply flare, and provides non-image-forming light, since it is not directly focused by the lens."

I believe that since the topic was the camera quadrant and flare from a camera, it's there shouldn't be any confusion. Take this diagram from Photographic Materials. It's rather obvious that they are referring to.

1669082797094.png
 

Sirius Glass

Subscriber
Joined
Jan 18, 2007
Messages
50,316
Location
Southern California
Format
Multi Format
Compensating for flare is a fool's folly since that is an uncontrolled variable. Every lens and every camera configuration with or without lens hoods has different flare characteristics. Just leave flare out and let each user make their adjustments.
 
Joined
Jan 7, 2005
Messages
2,609
Location
Los Angeles
Format
4x5 Format
So I went back to my code. I wrote the flare function a long time ago. It turns out, I had implemented the variable flare model and the fixed flare model. I also added the "practical" flare model from your paper. Here's command line output for the "normal" LSLR table and for the KODAK T-MAX P3200 LSLR data, with the flare factor of 0.4. Trying to keep the discussion relevant to the thread :smile:
View attachment 322431

KODAK T-MAX P3200
View attachment 322433

As far as N-numbers are concerned, I have implemented both the BTZS method and a very similar method to what is in your "What is Normal?" paper, with the BTZS being the default option. Please, don't hate me for it :smile:.

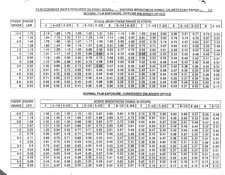
The question is always what most closely conforms to reality. I've seen all of these used at some point and by serious people. Notice how +2 fixed flare is practically the same as +3 variable flare? Both can't be right. Dick Dickerson at Kodak once gave me a sheet with the CIs for different paper grades and different luminance ranges (attached). It uses a fixed density model with 0.40 for flare. Kodak's development data sheets; however, have different aim CIs.. Those CIs more closely fit the variable model, but the data sheets don't use luminance ranges. They use EIs. Pushing for speed works differently than stickily pushing for contrast. In Way Beyond Monochrome, Ralph's developmental model is almost identical to my practical model even though we approached it differently.

So are the values hard wired into the program? What if a condenser enlarger is used or the aim is to make Platinum prints? I believe platinum has an LER of 1.60. That would make normal CI 0.88, Are you able to use a formula instead?

Contrast Indexes - Kodak.jpg
 
Last edited:
OP
OP
aparat

aparat

Member
Joined
Sep 5, 2007
Messages
1,177
Location
Saint Paul,
Format
35mm
The question is always what most closely conforms to reality. I've seen all of these used at some point and by serious people. Notice how +2 fixed flare is practically the same as +3 variable flare? Both can't be right. Dick Dickerson at Kodak once gave me a sheet with the CIs for different paper grades and different luminance ranges (attached). It uses a fixed density model with 0.40 for flare. Kodak's development data sheets; however, have different aim CIs.. Those CIs more closely fit the variable model, but the data sheets don't use luminance ranges. They use EIs. Pushing for speed works differently than stickily pushing for contrast. In Way Beyond Monochrome, Ralph's developmental model is almost identical to my practical model even though we approached it differently.

So the values are hard wired into the program? What if a condenser enlarger is used or the aim is make Platinum prints? I believe platinum has an LER of 1.60. That would make normal CI 0.88, Are you able to use a formula instead?
Yes, I am using a formula for everything. Nothing is hard-coded. I do have a few look-up tables, similar to the Kodak one you just posted, but that's for reference, never for computation.

Thank you for posting the Kodak table. I will see if I can figure out a statistical model for it. Do you happen to know how they came up with it?

Two different roads leading to the same destination. That is always cool.
 
Joined
Jan 7, 2005
Messages
2,609
Location
Los Angeles
Format
4x5 Format
Yes, I am using a formula for everything. Nothing is hard-coded. I do have a few look-up tables, similar to the Kodak one you just posted, but that's for reference, never for computation.

Thank you for posting the Kodak table. I will see if I can figure out a statistical model for it. Do you happen to know how they came up with it?

Two different roads leading to the same destination. That is always cool.

It is sounding like it's going to be a very effective and versatile tool.

Check the CI for Grade 2 (1.05) and 7 1/3 stops. - CI 0.58. The table is based on the statistical average luminance range of 2.20 and a fixed flare of 0.40. LER / (LSLR - Flare). Here is a table from Photographic Materials and Processes that references the LERs for different paper grades.
LER and NDR chart.jpg
 
OP
OP
aparat

aparat

Member
Joined
Sep 5, 2007
Messages
1,177
Location
Saint Paul,
Format
35mm
It is sounding like it's going to be a very effective and versatile tool.

Check the CI for Grade 2 (1.05) and 7 1/3 stops. - CI 0.58. The table is based on the statistical average luminance range of 2.20 and a fixed flare of 0.40. LER / (LSLR - Flare). Here is a table from Photographic Materials and Processes that references the LERs for different paper grades.
Very cool. I have this book and learned a lot from it. It's got a lot of detail, but with clear explanations and beautiful graphics.

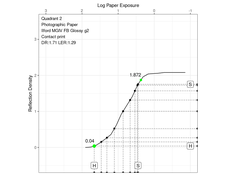
I remember you pointed out that my Grade 2 LER was too high in Quadrant 2, at 1.29. You were right, of course. I went back to my paper data file, and that is the correct value. In my notes, I found that I used a dichroic enlarger head, so the grade designations were probably somewhat arbitrary. It was a while back. I should retest the new Ilford MG emulsion using the under-the-lens filters, which I prefer these days, anyway.
Q2.png
 

albada

Subscriber
Joined
Apr 10, 2008
Messages
2,172
Location
Escondido, C
Format
35mm RF
It is sounding like it's going to be a very effective and versatile tool.

Check the CI for Grade 2 (1.05) and 7 1/3 stops. - CI 0.58. The table is based on the statistical average luminance range of 2.20 and a fixed flare of 0.40. LER / (LSLR - Flare). Here is a table from Photographic Materials and Processes that references the LERs for different paper grades.
View attachment 322441

This brings up something that disturbs me. The LER used to determine grade is

log(exposure(for density 0.9*Dmax)) - log(exposure(for density 0.09)).​

My measured Dmax for Ilford RC is 2.10, and Dmax for Foma RC is 1.87. Because Foma's LER uses a lower Dmax, LER itself is lower, even when the straight-line portion of its curve matches that of Ilford. In other words, the grade computed for Foma is too high. Consequently, if you were to print the same image on both Ilford's and Foma's at exactly grade 2 as computed above (which is possible using LEDs and a microcontroller), Foma's print would have lower contrast. In effect, the term 0.9*Dmax lets Foma cheat and claim higher contrast than it actually achieves.

In order for different papers to print at the same contrast (and thus look the same) for the same grade, it seems to me that grade should be based on the slope of the central portion of the paper's HD curve. I see two ways to do this:
  1. Use the LER between the densities of zones VII to III (i.e., densities of 0.19 and 1.61). This solution assumes 1.61 is off the shoulder for all papers. Grade would be determined by LER, as in the past, but the thresholds for grades would change.
  2. Use the LER between densities Dmin+0.07*DR and Dmax-0.10*DR, where DR = Dmax - Dmin. The constants 0.07 and 0.10 match zones VII and III when Dmax=2.1, but we can use 0.08 or somesuch for both -- I doubt it matters. Grade would be determined by slope and not by LER.
I suspect the second way computes the central slope more accurately, but it's more complex.

I believe this has not been a problem in the past because most people use tungsten lamps with filters, and as long as Foma yields the same visual contrast as Ilford with the same filters, users are happy. But when we apply the standard definitions to make LER (and thus grade) the same between papers via a microcontroller, the papers don't respond with the same contrast. I think this problem will become more serious as LEDs become more popular.

Your thoughts about this problem?
 
Joined
Jan 7, 2005
Messages
2,609
Location
Los Angeles
Format
4x5 Format
This brings up something that disturbs me. The LER used to determine grade is

log(exposure(for density 0.9*Dmax)) - log(exposure(for density 0.09)).​

My measured Dmax for Ilford RC is 2.10, and Dmax for Foma RC is 1.87. Because Foma's LER uses a lower Dmax, LER itself is lower, even when the straight-line portion of its curve matches that of Ilford. In other words, the grade computed for Foma is too high. Consequently, if you were to print the same image on both Ilford's and Foma's at exactly grade 2 as computed above (which is possible using LEDs and a microcontroller), Foma's print would have lower contrast. In effect, the term 0.9*Dmax lets Foma cheat and claim higher contrast than it actually achieves.

In order for different papers to print at the same contrast (and thus look the same) for the same grade, it seems to me that grade should be based on the slope of the central portion of the paper's HD curve. I see two ways to do this:
  1. Use the LER between the densities of zones VII to III (i.e., densities of 0.19 and 1.61). This solution assumes 1.61 is off the shoulder for all papers. Grade would be determined by LER, as in the past, but the thresholds for grades would change.
  2. Use the LER between densities Dmin+0.07*DR and Dmax-0.10*DR, where DR = Dmax - Dmin. The constants 0.07 and 0.10 match zones VII and III when Dmax=2.1, but we can use 0.08 or somesuch for both -- I doubt it matters. Grade would be determined by slope and not by LER.
I suspect the second way computes the central slope more accurately, but it's more complex.

I believe this has not been a problem in the past because most people use tungsten lamps with filters, and as long as Foma yields the same visual contrast as Ilford with the same filters, users are happy. But when we apply the standard definitions to make LER (and thus grade) the same between papers via a microcontroller, the papers don't respond with the same contrast. I think this problem will become more serious as LEDs become more popular.

Your thoughts about this problem?

Any chance you can illustrate this? Maybe in a new thread.
 
Photrio.com contains affiliate links to products. We may receive a commission for purchases made through these links.
To read our full affiliate disclosure statement please click Here.

PHOTRIO PARTNERS EQUALLY FUNDING OUR COMMUNITY:


Ilford ADOX Freestyle Photographic Stearman Press Weldon Color Lab Blue Moon Camera & Machine
Top Bottom