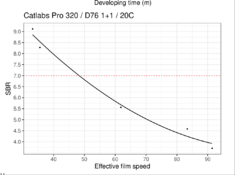
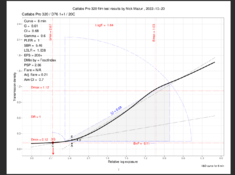
I have finished doing my basic “curve family” analysis of the Catlabs Pro 320 film (35 mm version). There’s a lot to unpack, and still more to come, so I will try to present this in chunks, rather than all at once. My thanks to Catlabs for shipping the film very promptly! The obvious disclaimer is that these results are meant to be approximate, “ballpark” estimates of the film’s performance. As they say, YMMV.
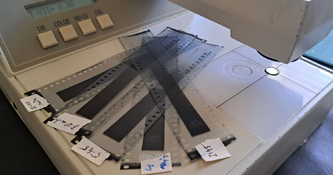
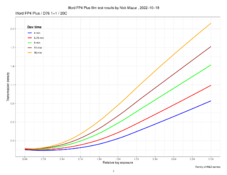
First of all, the Catlabs film produces somewhat unusual-looking curves, which makes them challenging to model and analyze. It took me a few attempts before I decided on the “correct” exposure for the test. In the end, I settled on the amount of exposure I typically use for ISO 100 films, such as Ilford Delta and Ilford FP4 Plus. The exposure ends up being around 3.35 Millilux Seconds in my DIY uncalibrated sensitometer. The reason I had to use this DIY device was to avoid using exposures upwards of 1 second, which would have been necessary with my calibrated sensitometer. Below, please, compare a typical curve family of Ilford FP4 Plus with that of Catlabs Pro 320, both families of curves obtained by the same DIY device, and processed in the same way. The comparison is just for the overall shapes of the curves, nothing else.
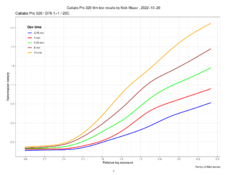
Next, I want to address the question of ISO speed. You will see from this particular analysis that the “ideal” ISO curve (in pink) obtains the speed of around ISO 65, using the 0.1 criterion. As
@MattKing ,
@ic-racer , and others pointed out, the “actual” speed will likely be a bit higher for people who judge photographs visually, i.e., actual photographers

. For example, the 0.3G (Fractional Gradient) criterion, which has been argued to be closely correlated with so-called “print-judgment speeds,” obtains speeds that are, on average, a stop or so greater. See the summary table for the Log Exposure values at the 0.3G speed point and compare them to the ISO 0.1 speed points (“Emin” values on each individual curve plot, pp. 4-8). This would explain, I think, the fact that people are exposing this film at EI 100 and EI 200 and getting very nice results. Of course, there are other factors at play, such as processing, scanning, viewing, printing, etc.). I will show this sped-point effect in more detail later.
The last thing I want to mention today is the comparison between the results obtained by the BTZS application, Win Plotter, and those obtained by my own program (it doesn’t have a name). I chose a Win Plotter type of analysis, using relative log exposure values (among other things), to make this comparison useful. By and large, the results are consistent. The differences stem from, mainly, the differences in algorithms for modeling the curves and interpolation schemes. I do not know how Phil Davis modeled the curves and what kind of interpolation (and extrapolation) he used, so I cannot make my results identical to his. Also, as you can see on page 2 of the Win Plotter output and page 3 of mine, the ISO triangle is in a slightly different spot. The hypothetical ISO curve (plotted in pink) is supposed to have the slope of G=0.62. This would put it “above” (or in front of) of the 5:45 min. curve (as in my output), and not “below” (or behind) it (as in Win Plotter). My guess is that the discrepancy is caused the the difficulty in modeling these Catlabs curves, but that is just a guess. The difference in speed is immaterial, in my opinion.
There’s more coming soon.


 . For example, the 0.3G (Fractional Gradient) criterion, which has been argued to be closely correlated with so-called “print-judgment speeds,” obtains speeds that are, on average, a stop or so greater. See the summary table for the Log Exposure values at the 0.3G speed point and compare them to the ISO 0.1 speed points (“Emin” values on each individual curve plot, pp. 4-8). This would explain, I think, the fact that people are exposing this film at EI 100 and EI 200 and getting very nice results. Of course, there are other factors at play, such as processing, scanning, viewing, printing, etc.). I will show this sped-point effect in more detail later.