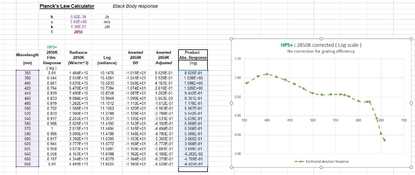
It can be done either way, Bernard. Given that we are starting from log values with Ilford, and ending with something like the density curves by Kodak ( also in log space ) then it makes sense just to convert the 2850K black-body function into log values, then multiply by -1 to invert it, and use all logs the calc.
I beg to differ. I believe the scale of the Ilford plot is bogus, not even the log of an actual sensitivity. Or only within an arbitrary scale factor.
As I explained previously. A multiplicative factor on the actual, or natural (as opposed to logarithm-of-) value of sensitivity is an
insignificant issue as long as we are not discussing speed calibration. But an unknown factor on the log leads to nonsense. Say you are given a plot of "X" versus lambda and you believe that is the log of sensitivity "S".
X = log10(S)
You prepare a table of values of the source spectral flux density versus lambda, say, "F". And, as you propose, you perform
C = X - log10(F)
So, since allegedly X = log10(S), you have performed
C = log10(S) - log10(F) = log10(S/F)
Correction achieved on a log scale, ready to compare with Kodak plot.
BUT a lab assistant now informs you that there was a scale factor of 2 (say... just an example) in the original plot for "X", so that:
X = 2 * log10(S)
and what you just computed was actually:
C = 2 * log10(S) - log10(F) = log10(S^2 / F)
so you have applied the source flux correction ... to the square of the sensitivity. Or, just the same cast differently:
C = 2 * (log10(S) - 0.5 * log10(F)) = 2 * log10(S/sqrt(F))
Now you have applied a correction by the square root of the flux...
In either case the result is just a number without any meaning; not even dimensionally correct.
Back to the real world. There is no lab assistant. The factor is not 2. We just
do not know.
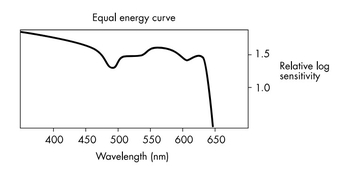
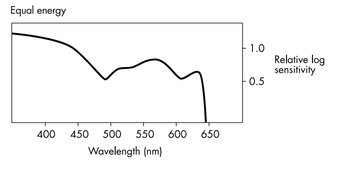
As a further hint that the scale on the vertical axis of the Ilford plot is a cosmetic afterthought, look closely. There is no "0" tick mark and no "0" label. Maybe because it's self-obvious that the bottom is at "0"?
Now take a ruler. The interval from bottom to "0.5" is larger than between "0.5" and "1.0". Nitpicking? No proper technical or scientific graph should have such issues.