Spectral sensitivity and its possible consequences

pasopvoordehondkl.jpg

A
pasopvoordehondkl.jpg

  • 0
  • 0
  • 222
<--

D
<--

  • 4
  • 0
  • 263
The Bank

A
The Bank

  • 0
  • 1
  • 342
Kildare

A
Kildare

  • 2
  • 0
  • 559
Sonatas XII-27 (Homes)

A
Sonatas XII-27 (Homes)

  • 0
  • 1
  • 656

Recent Classifieds

Forum statistics

Threads
199,324
Messages
2,789,613
Members
99,872
Latest member
Brucbe_uk
Recent bookmarks
1

DREW WILEY

Member
Joined
Jul 14, 2011
Messages
14,126
Format
8x10 Format
Well that was a bit of a find. Too bad the thin end is chipped off. I wonder what machine that came from. But you could get a new calibrated Stouffer step tablet on film at reasonable cost. I like the ones where the tablet is divided into two pieces on one piece of 4X5 film. In the meantime, have fun with what you have.
 
Last edited:

Mark J

Member
Joined
Mar 23, 2023
Messages
438
Location
Denbigh, North Wales UK
Format
Multi Format
1. Probably. Impact at the 10% level? 50%?
Maybe 60 to 70% at each end. There are some examples shown here in Edmund Scientific's range :
Go for the 'Technical Information' tab.

2. But that was not my main point. My main point is that you want to apply this correction and other (like the 2850K blackbody distribution) to the real sensitivity function, not to its logarithm. And we are missing the scale for the log as displayed, which is not equivalent to a scale factor for the sensitivity itself.

It can be done either way, Bernard. Given that we are starting from log values with Ilford, and ending with something like the density curves by Kodak ( also in log space ) then it makes sense just to convert the 2850K black-body function into log values, then multiply by -1 to invert it, and use all logs the calc.
I was hoping to do this today , but work has been hectic.

Other comment :
I got a response from the Ilford technical contact, David. He advised that their spectrograms were typically enough for people to compare films, but that he would forward my comments also to their physicist. I responded with a few more comment for him to pass on, to explain what we'd already done, and where we thought the remaining issues were. Hopefully we will get some useful advice in a day or two.

I sent an email to our test engineer at work asking for more detail about our monochromator(s). I should get some comment tomorrow.
 

bernard_L

Member
Joined
Feb 17, 2008
Messages
2,062
Format
Multi Format
It can be done either way, Bernard. Given that we are starting from log values with Ilford, and ending with something like the density curves by Kodak ( also in log space ) then it makes sense just to convert the 2850K black-body function into log values, then multiply by -1 to invert it, and use all logs the calc.
I beg to differ. I believe the scale of the Ilford plot is bogus, not even the log of an actual sensitivity. Or only within an arbitrary scale factor.
As I explained previously. A multiplicative factor on the actual, or natural (as opposed to logarithm-of-) value of sensitivity is an insignificant issue as long as we are not discussing speed calibration. But an unknown factor on the log leads to nonsense. Say you are given a plot of "X" versus lambda and you believe that is the log of sensitivity "S".
X = log10(S)
You prepare a table of values of the source spectral flux density versus lambda, say, "F". And, as you propose, you perform
C = X - log10(F)
So, since allegedly X = log10(S), you have performed
C = log10(S) - log10(F) = log10(S/F)
Correction achieved on a log scale, ready to compare with Kodak plot.
BUT a lab assistant now informs you that there was a scale factor of 2 (say... just an example) in the original plot for "X", so that:
X = 2 * log10(S)
and what you just computed was actually:
C = 2 * log10(S) - log10(F) = log10(S^2 / F)
so you have applied the source flux correction ... to the square of the sensitivity. Or, just the same cast differently:
C = 2 * (log10(S) - 0.5 * log10(F)) = 2 * log10(S/sqrt(F))
Now you have applied a correction by the square root of the flux...
In either case the result is just a number without any meaning; not even dimensionally correct.

Back to the real world. There is no lab assistant. The factor is not 2. We just do not know.

As a further hint that the scale on the vertical axis of the Ilford plot is a cosmetic afterthought, look closely. There is no "0" tick mark and no "0" label. Maybe because it's self-obvious that the bottom is at "0"?
Now take a ruler. The interval from bottom to "0.5" is larger than between "0.5" and "1.0". Nitpicking? No proper technical or scientific graph should have such issues.
1716233025340.png


Mark J

Member
Joined
Mar 23, 2023
Messages
438
Location
Denbigh, North Wales UK
Format
Multi Format
I'm starting to think it will be a full-time job to keep up with all of your points and questions. I haven't got this time, sorry. I am just trying to work through slowly in my spare time while also doing photography and developing film.
A lot of the points you raise above should be aimed at Ilford, if you are concerned. I can't answer for them.
 
OP
OP
snusmumriken

snusmumriken

Subscriber
Joined
Jul 22, 2021
Messages
2,545
Location
Salisbury, UK
Format
35mm
No proper technical or scientific graph should have such issues.
I agree. I spent decades refereeing papers, and would have heavily criticised this. Maybe it is deliberate obfuscation (although why bother?), or perhaps it is just sexing-up of a boring technical figure by a publication stylist.

Since you mentioned dimensionality, what do we think the units of the Ilford sensitivity data (in their natural state) would have been?
 

Mark J

Member
Joined
Mar 23, 2023
Messages
438
Location
Denbigh, North Wales UK
Format
Multi Format
I have been very busy at work today. I need to take the time to read through a lot of the recent postings on this thread and respond when I have time and am not stressed.

On the Ilford plot, I suppose the fact that it's a Log plot means that it doesn't have to stop at zero. However, it would have been a nice idea for them to have put a tick mark at zero.
 

Bill Burk

Subscriber
Joined
Feb 9, 2010
Messages
9,332
Format
4x5 Format
Well that was a bit of a find. Too bad the thin end is chipped off. I wonder what machine that came from. But you could get a new calibrated Stouffer step tablet on film at reasonable cost. I like the ones where the tablet is divided into two pieces on one piece of 4X5 film. In the meantime, have fun with what you have.

When the guy told me it was chipped I told him to send it anyway. He sent the chips, it’s really not much, just that bit you see missing. Good thing I took it, haven’t seen one anywhere since.

I’ve got a bundle of goodies from Stouffer including a calibrated T2115c and the unlisted “Kodak” half-inch strip.

I’ll try to do something fun with it
 

bernard_L

Member
Joined
Feb 17, 2008
Messages
2,062
Format
Multi Format
I'm starting to think it will be a full-time job to keep up with all of your points and questions.
Not so many points, actually. Everything is in the so-called executive summary of my post #57. A connected sequence of 7 bullet points. Actually just one point broken down to elementary steps.

Yes, I wrote a number of lines.
Post #61. Answer your question re: "qualitative". And re-state that IMO the main issue is with the vertical (not horizontal) axis.
Post #65. Detailed answers to @snusmumriken questions
Post #78. Re-phrase, in the hope of getting the message across, the issue raised in post #57.

So my posts since #57 have not been adding new points and questions. Just striving to make my point clear.
 

Lachlan Young

Member
Joined
Dec 2, 2005
Messages
4,963
Location
Glasgow
Format
Multi Format
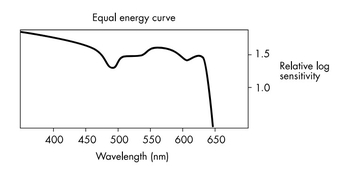
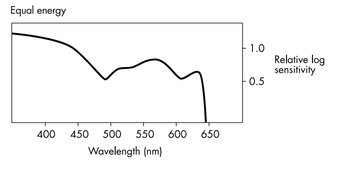
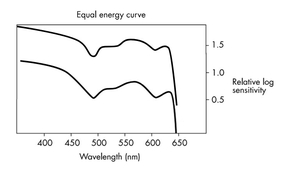
4 pages in, no one seems to have found the Equal Energy Curve for HP5+ that Ilford used to give in the data sheets. I've attached it to this post.

Edited to add: I thought that the FP4+ curve, and a very rough composite of the two might give some more contextual understanding about what was probably a graphic design decision - though I'd place little absolute value on the log sensitivity scale between the two - it's pretty clear that it's explicitly 'relative'.
 

Attachments

  • Equal_energy_HP5+.jpg
    Equal_energy_HP5+.jpg
    26.3 KB · Views: 51
  • Equal_energy_FP4+.jpg
    Equal_energy_FP4+.jpg
    43.4 KB · Views: 44
  • Equal_energy_HP5+_and_FP4+.jpg
    Equal_energy_HP5+_and_FP4+.jpg
    58.2 KB · Views: 45
Last edited:

DREW WILEY

Member
Joined
Jul 14, 2011
Messages
14,126
Format
8x10 Format
Mfg Tech Sheets aren't research papers. They're basic guidelines, or simplified starting points. And both their characteristics curves and spectral sensitivity plots have been shrunken and generalized for sake of taking up a minimum amount of space on the page. This inevitably comes at the cost of better specificity. Those sheet aren't published for sake of engineers, but for country bumpkin photographers like me; and even I prefer my own plots.
 
Last edited:
OP
OP
snusmumriken

snusmumriken

Subscriber
Joined
Jul 22, 2021
Messages
2,545
Location
Salisbury, UK
Format
35mm
4 pages in, no one seems to have found the Equal Energy Curve for HP5+ that Ilford used to give in the data sheets. I've attached it to this post.

Edited to add: I thought that the FP4+ curve, and a very rough composite of the two might give some more contextual understanding about what was probably a graphic design decision - though I'd place little absolute value on the log sensitivity scale between the two - it's pretty clear that it's explicitly 'relative'.
Ooo, those are interesting! Thank you, Lachlan.

So while the scale on the wedge spectrograms appeared to be scaled relative to highest peak, the scale on these equal energy plots is not - and presumably cannot be, since the maximum is probably off the left hand side of the plot. We don't know what either scale represents unless the Ilford people can enlighten us.

Isn't it a bit strange that the quite striking differences between HP5+ and FP4+ noticeable in the shape of the wedge spectrograms are not obviously apparent in these equal energy plots?

I'm starting to think it will be a full-time job to keep up with all of your points and questions. I haven't got this time, sorry. I am just trying to work through slowly in my spare time while also doing photography and developing film.
A lot of the points you raise above should be aimed at Ilford, if you are concerned. I can't answer for them.

No expectations whatever, Mark. Many thanks for your time thus far. Please keep us posted when you hear back from the Ilford technicians.
 

bernard_L

Member
Joined
Feb 17, 2008
Messages
2,062
Format
Multi Format
Since you mentioned dimensionality, what do we think the units of the Ilford sensitivity data (in their natural state) would have been?
Good question. Absent the information on both:
  • the spectral flux density of the source how many watts per nanometer)
  • the properties of the dispersing device (how many mm in the plane of the film per nanometer)
  • and other factors such as transmission versus wavelength
the raw information of the spectrogram, i.e. "how many mm into the wedge can you reach film density D, versus distance along the dispersion axis" is tied to the above setup-specific data (which has dimensionality) but is not by itself (as far as I can see) amenable to dimensional analysis.

So I take back the dimensionality argument. That was a passing remark, and I stay on my other arguments.
 

Mark J

Member
Joined
Mar 23, 2023
Messages
438
Location
Denbigh, North Wales UK
Format
Multi Format
Sounds like I'm well behind the curve now... but anyway -
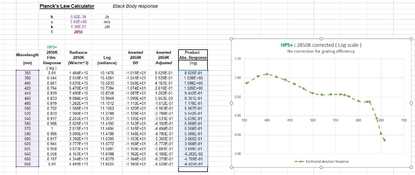
Here is an update of the spreadsheet, for HP5+, recognising that the starting data from Ilford was on a log scale.
Hence the calc was done in 'log space' excepting that the black body curve had to be converted to Log10 values in the middle.

The calc does not ( yet ) include any attempt to allow for grating efficiency across the waveband or any other effects that I haven't had time to understand yet .
 

Attachments

  • HP5_update.JPG
    HP5_update.JPG
    159.3 KB · Views: 38

Lachlan Young

Member
Joined
Dec 2, 2005
Messages
4,963
Location
Glasgow
Format
Multi Format
Isn't it a bit strange that the quite striking differences between HP5+ and FP4+ noticeable in the shape of the wedge spectrograms are not obviously apparent in these equal energy plots?

Effectively one is done with a tungsten source and one with a nominally daylight balanced one. Even Type C panchromatic films usually have a slightly lower effective speed in tungsten balanced light - and I think the plots demonstrate both this and (more importantly) the cultural practices of the films' intended usage when they were first engineered in non-plus form (about a decade apart). In particular the shift away from predominantly tungsten lighting in studio environments, and a near total dominance of electronic flash as the main artificial light in reportage - and, possibly, the first steps towards understanding what the most optimal sensitising is for representing colour in B&W.

How far back were those published, out of interest ?

They were in the datasheets until the layouts were rejigged somewhere around the turn of the century.
 

bernard_L

Member
Joined
Feb 17, 2008
Messages
2,062
Format
Multi Format
Received this today from Ilford, a response to my query May 17. (replied "thank you"). Thought I might as well copy it here for the record. Nothing fundamentally new. Puzzling, though, that the in-house capability to generate equal-energy plots would have been lost.
Dear M. Lazareff,
Thank you for your query. Our current equipment only generates a relative sensitivity profile with a 2856K (Illuminant A) light source. We cannot currently generate quantitative radiometric sensitivity data. We are currently looking to see if we can convert to a D50 light source or equivalent but this may take some time.
Regards,
 
Last edited by a moderator:

Nicholas Lindan

Advertiser
Advertiser
Joined
Sep 2, 2006
Messages
4,252
Location
Cleveland, Ohio
Format
Multi Format
I just picked up from the library the book Spectral Studies of the Photographic Process by Yu. N. Gorokhovskii, 1965 Focal Press, translated from the Russian.

If you like spectral response curves then this is the book for you. I haven't dug into it yet, I've just thumbed through the book.
 
  • Craqdi
  • Craqdi
  • Deleted
  • Reason: potential spam
Photrio.com contains affiliate links to products. We may receive a commission for purchases made through these links.
To read our full affiliate disclosure statement please click Here.

PHOTRIO PARTNERS EQUALLY FUNDING OUR COMMUNITY:


Ilford ADOX Freestyle Photographic Stearman Press Weldon Color Lab Blue Moon Camera & Machine
Top Bottom