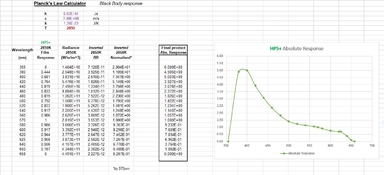
I don't follow, Bernard. I don't see how it's relevant that the distribution is different per frequency, when we're only working with graphs that give the data per wavelength. Conceptually, multiplying the continuous curve of the inverse of the energy per wavelength of a blackbody radiator with Ilford's continuous curve of spectral sensitivity should allow you to remove most of the influence of them not normalising for energy output of the light source they used. Doing the same with discrete numbers instead will of course introduce loss of precision, but I don't see how it would make it invalid.
Now, that won't let you correct for all the differences in experimental setup, I agree. Their setup would have given them a set of narrow band responses rather than the response for monochromatic light. However, to produce the curve they provided they would have had to correct for some of the potential short comings in their setup, to provide them with an adequate number of data point to produce their graph.
So while the correction Mark is doing won't correct for all the differences, it should make the graphs much more comparable.
@khh
I agree on one point: my criticism of Mark's correction was too specific and too centered on a technical point: the various possible ways to define a spectral distribution.
Kodak definition. Is clearly stated below the sensitivity graph of, e.g. TX400 datasheet:
No need to specify if the photons are coming from a 2800K blackbody, or 5000K, or other light source. At each wavelength, what energy per unit film area is necessary to produce a specified fixed density. If we think of this as a function, or a two-column spreadsheet, we have wavelength in the first column and ergs (or joules) per cm² (or m²) in the second column. Take inverse, because we talk about
sensitivity, then log for the usual reason (display a large dynamic range on a graph). So far so good.
Ilford definition. Is undefined. The ordinate is labeled "sensitivity" without any definition. And this mention "tungsten light (2850K)". So, yes, I agree, the first reaction is that this light source is so deficient in blue light that the measurement mis-represents the film's sensitivity at blue wavelengths. And can we correct for that? Dividing by the energy distribution of a 2850K blackbody? But what is on the numerator of that fraction? the "Sensitivity", which is undefined, so... the result is also undefined.
When you correct a raw experimental result, it is because you have identified a feature of the equipment/process that you understand well enough co compute its effect on the raw result, apply a correction, and infer a corrected value. For instance, as I mentioned in my previous post, if the Ilford spectrogram is obtained by dispersing a tungsten filament's light through a prism, depending on the glass used, and the angles, distances, etc, the red light might be more/less dispersed (millimeters along spectrum versus wavelength) than the blue light, leading to an unfair/improper ratio of sensitivities at the two ends of the spectrum. Just an example. Key point is we don't know the measurement process, therefore we cannot correct.
Only a guess. I believe the Ilford engineers have properly corrected for the deficiency of a 2850K blackbody in blue energy. I write "somehow" because there are several equally plausible, but not equivalent, ways of doing that. And that they also corrected for the dispersion law of the prism and other dirty details. And that the mention "Wedge spectrogram to tungsten light (2850K)", while technically correct (that was the source used in the measurement), is misleading, because the specifics of the light source and dispersing aparatus have been corrected for in the displayed result.
A hint (only a hint) that this is the case is the large spike in sensitivity in the corrected curve obtained by Mark.


