Spectral sensitivity and its possible consequences

pasopvoordehondkl.jpg

A
pasopvoordehondkl.jpg

  • 0
  • 0
  • 120
<--

D
<--

  • 3
  • 0
  • 167
The Bank

A
The Bank

  • 0
  • 1
  • 247
Kildare

A
Kildare

  • 1
  • 0
  • 467
Sonatas XII-27 (Homes)

A
Sonatas XII-27 (Homes)

  • 0
  • 1
  • 562

Recent Classifieds

Forum statistics

Threads
199,321
Messages
2,789,587
Members
99,871
Latest member
semdot14
Recent bookmarks
0

koraks

Moderator
Moderator
Joined
Nov 29, 2018
Messages
23,620
Location
Europe
Format
Multi Format
Since the Kodak data is presented as a 'spectral sensitivity curve', my assumption is that this was done with a monochromator, which provides a (calibrated) flat response vs. wavelength over the whole spectrum.

They specify erg/cm2 as the unit of exposure as the basis for this chart. So we know for a fact that spectral distribution of the light source used is corrected for; they're explicit about it. Note also that the sensitivity data are provided in absolute form, which reflects in the difference between the TriX and DoubleX plots.
 

pentaxuser

Member
Joined
May 9, 2005
Messages
20,038
Location
Daventry, No
Format
35mm
Red sensitive films tend to make skin go paler, green sensitive will make it seem more tan with more contrast to freckles and the like. A note if you do portraits, they used to give actresses lipsticks with odd colors when they shot them on films with less balanced spectral sensitivities.

Yes I seem to recall reading about what the BBC did ín its early television days of the pre-Second World War period and early post war period to female announcers' lips I They were told to wear green lipstick instead of read to prevent their lips appearing almost black and giving them a "Morticia" look

In real life they looked ghastly but were relatively normal on TV

pentaxuser
 

DREW WILEY

Member
Joined
Jul 14, 2011
Messages
14,126
Format
8x10 Format
OK, all you math calculator whizz kids - I spent15 years with color spectrophotometers in relation to industrial pigments and dyed materials, as part of my overall job. The first of those I tested in relation to dye idiosyncrasies was an IBM full spectrum unit as big as an upright grand piano. Then I went to pulsed xenon beamsplitter units. I won't go into the details here. But it's remarkable how certain dyes can sometimes fool the best of them and skew the plot when significant color temperature shifts came into play. I tested for that kind of non-linear anomaly many times, in order to better predict the visual result my clients expected.

And the point I'm making is that, unless someone has specifically tested for that issue with the specific dyes in question, and how those film sensitizing dyes INTERACT with one another, you're leaving out an important variable. Does it matter or not, in terms of your calculations with these respective films - well, I don't know, and NEITHER DO YOU. That's the point. You are just assuming there is no change in the profile.

I also have a lot of old Kodak literature where some black and white film spectral charts are clearly labeled in reference to a 5500 K illuminant, and films in the same edition are labeled with some kind of warmer tungsten illuminant. Somewhere in all your equations you left out certain common sense factors. One needs to measure the END RESULT, not just presume you control the laws of the universe.
 

Mark J

Member
Joined
Mar 23, 2023
Messages
438
Location
Denbigh, North Wales UK
Format
Multi Format
Thanks Koraks.
Thanks for the correction Jonathan, but there are a couple of other points ( eg. a 569nm one ) on the FP4+ table that look to need correcting.

I have worked up the spreadsheet now ( in odd moments in meetings ! )
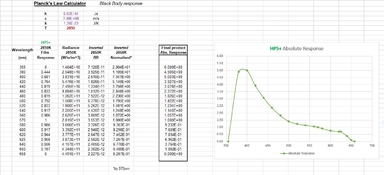
Here is a first-pass on HP5+
I have just realised that the Kodak sensitivity curves are on a Log plot, so will go back and add an extra column and do another graph later.
It should look a lot less weird and more like the Kodak Tri-X one then. Still, lots of sensitivity in the violet and UV, if you don't have a lens on there....

Drew, I still reject the relevance of your comments and you provide no other basis or justification for doing this another way. Your lack of respect ( given that Jonathan and Koraks agree with what I'm doing ) is borderline abusive. Please stop.
 

Attachments

  • HP5_first_pass.JPG
    HP5_first_pass.JPG
    157.5 KB · Views: 62

koraks

Moderator
Moderator
Joined
Nov 29, 2018
Messages
23,620
Location
Europe
Format
Multi Format
Somewhere in all your equations you left out certain common sense factors.
The 'common sense factors' you refer to are already compounded in the plots that are being compared.

Drew, I still reject the relevance of your comments and you provide no other basis or justification for doing this another way.

I agree; Drew, if you want to discuss the underlying physics, that's fine. Further repetition of points you've already made may be removed from the thread in order to prevent it from stalling in an infinite loop.
 

DREW WILEY

Member
Joined
Jul 14, 2011
Messages
14,126
Format
8x10 Format
Due to the potential for more variables than one first realizes, my own policy is simply to test any unfamiliar film/filter combination for the correct filter factors under real world conditions - whether outdoor lighting conditions, hot lights in a studio, and now the risk of discontinuous spectrums using LED lighting. Then there are the endless variables of how tones in nature, and even house paints, respond to film differently than our own eyes, etc, etc.
 
OP
OP
snusmumriken

snusmumriken

Subscriber
Joined
Jul 22, 2021
Messages
2,545
Location
Salisbury, UK
Format
35mm
Thanks Koraks.
Thanks for the correction Jonathan, but there are a couple of other points ( eg. a 569nm one ) on the FP4+ table that look to need correcting.

I have worked up the spreadsheet now ( in odd moments in meetings ! )
Here is a first-pass on HP5+
I have just realised that the Kodak sensitivity curves are on a Log plot, so will go back and add an extra column and do another graph later.
It should look a lot less weird and more like the Kodak Tri-X one then. Still, lots of sensitivity in the violet and UV, if you don't have a lens on there....

Drew, I still reject the relevance of your comments and you provide no other basis or justification for doing this another way. Your lack of respect ( given that Jonathan and Koraks agree with what I'm doing ) is borderline abusive. Please stop.
Mark, thank you so much for taking an interest in this. Apologies for the errors in the FP4+ data - too much haste. Here is a corrected version. I hope I've spotted everything. Quite a lumpy curve, this one.
1715848380400.png
 

bernard_L

Member
Joined
Feb 17, 2008
Messages
2,062
Format
Multi Format
Thanks Koraks.
Thanks for the correction Jonathan, but there are a couple of other points ( eg. a 569nm one ) on the FP4+ table that look to need correcting.

I have worked up the spreadsheet now ( in odd moments in meetings ! )
Here is a first-pass on HP5+
I have just realised that the Kodak sensitivity curves are on a Log plot, so will go back and add an extra column and do another graph later.
It should look a lot less weird and more like the Kodak Tri-X one then. Still, lots of sensitivity in the violet and UV, if you don't have a lens on there....

Drew, I still reject the relevance of your comments and you provide no other basis or justification for doing this another way. Your lack of respect ( given that Jonathan and Koraks agree with what I'm doing ) is borderline abusive. Please stop.

Sorry but I have to disagree. The Ilford plot does not contain enough information to directly compare it with the Kodak plot. You normalize by the blackbody energy distribution per unit wavelength. Had you normalized by the distribution per unit frequency (equally valid, and more commonly used in the radio region of the spectrum) you would have had a completely different result.
Do note that "per unit" is the key point here, distinct from the decision to plot versus wavelength or frequency. See, e.g. https://en.wikipedia.org/wiki/Planck's_law, the table under Different Forms. There is a factor λ² between the two forms.

That is not all. Ilford displays a wedge spectrogram. In concrete terms, their setup includes: a tungsten lamp (blackbody), a dispersing element (a prism? a grating?), a linear density wedge (perpendicular to the dispersion), and the film under test. Most probably, the dispersion law is neither equal wavelength nor equal frequency intervals per unit length in the dispersion unit. If a grating is used, it can be derived from first principles and the geometry of the setup; if a prism, it depends on the specifics of the dispersion law of the glass used.

Plus, the enormous peak around 400nm (extreme blue, near-UV) in your plot should set off an orange alarm blinking light: if true (in the sense of being directly comparable to the Kodak plots) that would mean that the Ilford engineers did a poor job of sensitizing to green (ortho) and red (pan) their emulsion.

The Kodak engineers did the homework to abstract their displayed result from the specifics of their experimental setup and present it in a way that reflects only the film properties: at each wavelength, how much energy (per unit area) do you need to produce a chosen density on the film (actually, the inverse, so the plot represents a sensitivity).

So, kudos for trying, but the Ilford publication does not contain sufficient information to analyze or reproduce their result. If it were a submission to a scientific journal, that would be a motive for revision or rejection.
 
Last edited:

khh

Member
Joined
Apr 25, 2020
Messages
90
Location
Oslo, Norway
Format
Multi Format
I don't follow, Bernard. I don't see how it's relevant that the distribution is different per frequency, when we're only working with graphs that give the data per wavelength. Conceptually, multiplying the continuous curve of the inverse of the energy per wavelength of a blackbody radiator with Ilford's continuous curve of spectral sensitivity should allow you to remove most of the influence of them not normalising for energy output of the light source they used. Doing the same with discrete numbers instead will of course introduce loss of precision, but I don't see how it would make it invalid.

Now, that won't let you correct for all the differences in experimental setup, I agree. Their setup would have given them a set of narrow band responses rather than the response for monochromatic light. However, to produce the curve they provided they would have had to correct for some of the potential short comings in their setup, to provide them with an adequate number of data point to produce their graph.

So while the correction Mark is doing won't correct for all the differences, it should make the graphs much more comparable.
 

Mark J

Member
Joined
Mar 23, 2023
Messages
438
Location
Denbigh, North Wales UK
Format
Multi Format
Sorry I've not been able to post, I was at work all day ( where I can't post ) and was very busy.
I have only had a brief chance to read through Bernard's observations, but thank you for taking the time to put that together.
I am going to quiz you in stages on your points, if that's OK ?

"Plus, the enormous peak around 400nm (extreme blue, near-UV) in your plot should set off an orange alarm blinking light: if true (in the sense of being directly comparable to the Kodak plots) that would mean that the Ilford engineers did a poor job of sensitizing to green (ortho) and red (pan) their emulsion."

It hadn't escaped my attention ! No, I was just wanting to complete the FP4+ data to the same stage, and have a think more about this.
Last night I was mulling over the two test methods and thinking about the prism (if used) in the wedge spectrogram. However this doesn't yield an explanation - rather the opposite, because the prism would if anything absorb UV ; so taking out some estimate of the prism effect from the Ilford data would boost the UV even more.

Thanks for the info Jonathan, I will finish off the estimate for FP4+ for what it's worth.

Bernard, when you talk about 'The Ilford publication' do you mean the film datasheet or something regarding the test ?
I have emailed Ilford Tech today to ask if they ever published anything on the conversion between these sort of testing methods.
Do you have a good link to something showing pictures of the test set-up ?
I can search in any case. I also have the Ilford Handbook ( I think a '60's edition ) , possibly they discuss it there ? ( will check )
 
OP
OP
snusmumriken

snusmumriken

Subscriber
Joined
Jul 22, 2021
Messages
2,545
Location
Salisbury, UK
Format
35mm
Do you have a good link to something showing pictures of the test set-up ?
I can search in any case. I also have the Ilford Handbook ( I think a '60's edition ) , possibly they discuss it there ? ( will check )

Yes, it's in the Ilford Handbook. They used a diffraction grating and neutral wedge. I'll try to attach a photo of the relevant pages.
IMG_3330.jpeg

IMG_3331.jpeg
 

Mark J

Member
Joined
Mar 23, 2023
Messages
438
Location
Denbigh, North Wales UK
Format
Multi Format
Excellent !
Well one error in my understanding that I've picked out already there, is that the Ilford graphs are logarithmic. That's easily accounted for, and will bring down the suspect extra sensitivity in the blue.

Edit : that's an elegant piece of kit actually. The diagram is simplified in that it doesn't attempt to show the wedge filter properly, in that this operates in the cross-wise plane, actually. But the nature of an absorbing filter is that linear changes in thickness produce a transmission variation that is a straight line in Log-space. Crafty !
 
Last edited:

bernard_L

Member
Joined
Feb 17, 2008
Messages
2,062
Format
Multi Format
I don't follow, Bernard. I don't see how it's relevant that the distribution is different per frequency, when we're only working with graphs that give the data per wavelength. Conceptually, multiplying the continuous curve of the inverse of the energy per wavelength of a blackbody radiator with Ilford's continuous curve of spectral sensitivity should allow you to remove most of the influence of them not normalising for energy output of the light source they used. Doing the same with discrete numbers instead will of course introduce loss of precision, but I don't see how it would make it invalid.

Now, that won't let you correct for all the differences in experimental setup, I agree. Their setup would have given them a set of narrow band responses rather than the response for monochromatic light. However, to produce the curve they provided they would have had to correct for some of the potential short comings in their setup, to provide them with an adequate number of data point to produce their graph.

So while the correction Mark is doing won't correct for all the differences, it should make the graphs much more comparable.
@khh
I agree on one point: my criticism of Mark's correction was too specific and too centered on a technical point: the various possible ways to define a spectral distribution.

Kodak definition. Is clearly stated below the sensitivity graph of, e.g. TX400 datasheet:
1715878707188.png

No need to specify if the photons are coming from a 2800K blackbody, or 5000K, or other light source. At each wavelength, what energy per unit film area is necessary to produce a specified fixed density. If we think of this as a function, or a two-column spreadsheet, we have wavelength in the first column and ergs (or joules) per cm² (or m²) in the second column. Take inverse, because we talk about sensitivity, then log for the usual reason (display a large dynamic range on a graph). So far so good.

Ilford definition. Is undefined. The ordinate is labeled "sensitivity" without any definition. And this mention "tungsten light (2850K)". So, yes, I agree, the first reaction is that this light source is so deficient in blue light that the measurement mis-represents the film's sensitivity at blue wavelengths. And can we correct for that? Dividing by the energy distribution of a 2850K blackbody? But what is on the numerator of that fraction? the "Sensitivity", which is undefined, so... the result is also undefined.
When you correct a raw experimental result, it is because you have identified a feature of the equipment/process that you understand well enough co compute its effect on the raw result, apply a correction, and infer a corrected value. For instance, as I mentioned in my previous post, if the Ilford spectrogram is obtained by dispersing a tungsten filament's light through a prism, depending on the glass used, and the angles, distances, etc, the red light might be more/less dispersed (millimeters along spectrum versus wavelength) than the blue light, leading to an unfair/improper ratio of sensitivities at the two ends of the spectrum. Just an example. Key point is we don't know the measurement process, therefore we cannot correct.

Only a guess. I believe the Ilford engineers have properly corrected for the deficiency of a 2850K blackbody in blue energy. I write "somehow" because there are several equally plausible, but not equivalent, ways of doing that. And that they also corrected for the dispersion law of the prism and other dirty details. And that the mention "Wedge spectrogram to tungsten light (2850K)", while technically correct (that was the source used in the measurement), is misleading, because the specifics of the light source and dispersing aparatus have been corrected for in the displayed result.
A hint (only a hint) that this is the case is the large spike in sensitivity in the corrected curve obtained by Mark.
 

Mark J

Member
Joined
Mar 23, 2023
Messages
438
Location
Denbigh, North Wales UK
Format
Multi Format
I think we are getting closer ...
Just one ground rule I should check -
Do we both agree that film responds to intensity ( W ) at any given wavelength, and not the number of photons ?
edit : sorry, I mean that the two tests do not differ in this regard.

Your further discussion of the prism in the last post is now not so relevant, because we can see that the standard apparatus uses a diffraction grating, rather than a prism, to disperse the light. Hence we do not have the non-linear dispersion of a glass material to contend with.
The only glass effect is from the ND cross-wedge, which will absorb violet and UV past a certain point (probably this effect starts to some extent below 420nm )
 
Last edited:

koraks

Moderator
Moderator
Joined
Nov 29, 2018
Messages
23,620
Location
Europe
Format
Multi Format
we don't know the measurement process, therefore we cannot correct.
Well, technically, we can correct, but we don't know how to interpret the outcome - or, in this case, we don't know if the outcome can be interpreted along the same lines as the benchmark.
A hint (only a hint) that this is the case is the large spike in sensitivity in the corrected curve obtained by Mark.

Then again, if you convert it to log, the spike isn't all that large anymore.

In fact, if you do that, I think what you're left with is a remarkable semblance in the pattern of both curves:
1715886733735.png
vs
1715886743530.png

Even without any corrections, that similarity looks like more than a coincidence to me.
We can argue about the absolute difference in height between these curves and I agree, based on your argument, that there are methodological issues related to it. But the feeling (yes, just that) I get from this is that there are technological similarities underlying these curves that make the products behave remarkably similar in terms of spectral response.
 

khh

Member
Joined
Apr 25, 2020
Messages
90
Location
Oslo, Norway
Format
Multi Format
Ilford definition. Is undefined. The ordinate is labeled "sensitivity" without any definition. And this mention "tungsten light (2850K)". So, yes, I agree, the first reaction is that this light source is so deficient in blue light that the measurement mis-represents the film's sensitivity at blue wavelengths. And can we correct for that? Dividing by the energy distribution of a 2850K blackbody? But what is on the numerator of that fraction? the "Sensitivity", which is undefined, so... the result is also undefined.
When you correct a raw experimental result, it is because you have identified a feature of the equipment/process that you understand well enough co compute its effect on the raw result, apply a correction, and infer a corrected value. For instance, as I mentioned in my previous post, if the Ilford spectrogram is obtained by dispersing a tungsten filament's light through a prism, depending on the glass used, and the angles, distances, etc, the red light might be more/less dispersed (millimeters along spectrum versus wavelength) than the blue light, leading to an unfair/improper ratio of sensitivities at the two ends of the spectrum. Just an example. Key point is we don't know the measurement process, therefore we cannot correct.
I think I follow now. Your point is that we don't know the correct unit for the sensitivity Ilford provides in their data sheet? So strictly speaking, we don't know what corrections, if any, have already been applied. And we don't know if the values they've given are relatable to the units provided by Kodak. They could be, e.g. if based on density of the wedge required to produce Dmax (if my understanding of the sensitometry is right, which is not a given). But likewise, they could be some other systematic measurement which is not easily relatable erg/cm2, but which would allow comparison between emulsions measured the same way.
That's a very fair point. I think Ilford would have chosen a measurement that should work out to be relatable, but that's only an assumption on my part at this point (though the book might provide additional details which would validate or invalidate such an assumption).


I think we are getting closer ...
Just one ground rule I should check -
Do we both agree that film responds to intensity ( W ) at any given wavelength, and not the number of photons ?
edit : sorry, I mean that the two tests do not differ in this regard.

Your further discussion of the prism in the last post is now not so relevant, because we can see that the standard apparatus uses a diffraction grating, rather than a prism, to disperse the light. Hence we do not have the non-linear dispersion of a glass material to contend with.
The only glass effect is from the ND cross-wedge, which will absorb violet and UV past a certain point (probably this effect starts to some extent below 420nm )
There also appear to be two lens elements, one after the light and one before the grating, that would also absorb UV. But then the excerpt Snusmumriken posted does state than the fall off in UV sensitivity is due to the measurement setup rather than the emulsion.
 
Last edited:

Mark J

Member
Joined
Mar 23, 2023
Messages
438
Location
Denbigh, North Wales UK
Format
Multi Format
Notes -
Small crown glass elements will not have much effect till below 400nm.
erg/cm2 is ultimately the same concept as Watts per unit area, which is intensity. The actual number may differ from some other intensity measure, but we are looking at relative effects from red to blue. Also this is radiometric, so involves no factor relating to the human eye.
 

Mark J

Member
Joined
Mar 23, 2023
Messages
438
Location
Denbigh, North Wales UK
Format
Multi Format
Sorry but I have to disagree. The Ilford plot does not contain enough information to directly compare it with the Kodak plot. You normalize by the blackbody energy distribution per unit wavelength. Had you normalized by the distribution per unit frequency (equally valid, and more commonly used in the radio region of the spectrum) you would have had a completely different result.
Do note that "per unit" is the key point here, distinct from the decision to plot versus wavelength or frequency. See, e.g. https://en.wikipedia.org/wiki/Planck's_law, the table under Different Forms. There is a factor λ² between the two forms.

That is not all. Ilford displays a wedge spectrogram. In concrete terms, their setup includes: a tungsten lamp (blackbody), a dispersing element (a prism? a grating?), a linear density wedge (perpendicular to the dispersion), and the film under test. Most probably, the dispersion law is neither equal wavelength nor equal frequency intervals per unit length in the dispersion unit. If a grating is used, it can be derived from first principles and the geometry of the setup; if a prism, it depends on the specifics of the dispersion law of the glass used.

After a hearty dinner and a soak in the bath, I feel that I've regained some clarity.
I'm not sure I understand all of the points you made above, but I think in my mind it's now clearer , I would say the following :

1. I don't think there are any hidden factors in the Kodak plots. I believe that light is provided at an equal level of intensity across the spectrum, and the film responds as shown.

2. In the wedge spectrogram method, I think there is one remaining question : if you feed a diffraction grating with a pure 'white' uniform source, then you measure across the resulting spectrum, from red to blue, is the intensity level uniform ? I suspect it is, but there are about 3 people at work who I could ask, in order to confirm this.

If no.2 above is correct, then i don't think there are any more hidden factors ( aside from glass transmission effects below 400nm ) , and we only have to allow for the correction factor for the 2850K source.
 

reddesert

Member
Joined
Jul 22, 2019
Messages
2,438
Location
SAZ
Format
Hybrid
I do spectrophotometric calibration (I'm an astronomer). There are often factors that confuse people.

It is more technically correct when making a plot like the Kodak plot to put the y-axis in units of flux density (sometimes called spectral flux), not flux. Flux density is flux per wavelength (like erg/s/cm^2/nm) or flux per frequency (erg/s/cm^2/Hz) as opposed to flux (erg/s/cm^2). You can think of this as an energy per bandwidth. Kodak also took the per-time factor out, but that's understandable since the film is measuring the cumulative energy that hits it, not the rate.

The dispersion of a diffraction grating is roughly constant in terms of angle per wavelength if a relatively small range of angles is used (this follows from the grating equation, and is not true for prisms, as several people have mentioned). In the Ilford schematic of the wedge spectrogram, if they used a grating and a relatively slow camera to image the diffracted light, then the wedge spectrogram should be roughly constant physical size per wavelength. (In Ilford's schematic, the camera lens is shown behind the diffraction grating, focusing collimated light from the grating through the wedge onto the film.) This means each unit of film area is seeing an equal wavelength range of incident light: this mm^2 of film sees light at 400-420 nm, the next mm^2 sees light at 420-440 nm, and so on. This is what we want to measure incident energy per spectral bandwidth, analogous to what I think the Kodak plot wants to show.

I'm not sure what Mark's question about what happens if you feed white light into a diffraction grating is asking. If you're asking whether the grating itself has an efficiency as a function of wavelength, it certainly does. This efficiency is usually maximum at the blaze angle of the grating, so it can be controlled by the choice of spectrograph angles and blaze angle. It is necessary to calibrate this out as part of system efficiency to interpret the measurements.

Edit to add: However, I think it's important to say that for pictorial use probably the main effects we can infer from a plot for a film are the total wavelength range and the blue-to-red tilt. For pictorial use, more subtle effects (e.g. how does film X or Y render skin features with a green filter) likely have be tested empirically rather than inferred from a sensitivity plot. That may be what Drew was trying to say albeit in a less diplomatic manner.
 

loccdor

Subscriber
Joined
Jan 12, 2024
Messages
1,580
Location
USA
Format
Multi Format

I was looking at Plus-X, Double-X, and Tri-X's spectral curves and they all remind of the first plot. If these 3 different films are so similar, of which I like them all but don't generally confuse them as the same when I see them used - it got me thinking to how much small differences on these plots make to our perception of the images produced. Your point about all of these films being from the same era and using similar technology makes a lot of sense.

For a long time I would enjoy playing the guess-the-film game, as I looked at hundreds of images and make an assessment of what film, format, etc. the image was shot on before peeking at the information the photographer provided. It's possible to get pretty good at that, when other factors (like the making of a print) aren't changing the character of the images.
 
OP
OP
snusmumriken

snusmumriken

Subscriber
Joined
Jul 22, 2021
Messages
2,545
Location
Salisbury, UK
Format
35mm
On the one hand, I wonder why film manufacturers publish these graphs if they don't want us to read anything into them; and on the other hand, why they publish them in such a simplified form if they do want us to.😕

My feeling is that this exercise probably can provide useful insight into differences between films. The difference between FP4+ and HP5+ under the same test conditions, for instance, looks to be quite significant. Does the greater speed of HP5+ come in part from its greater sensitivity at the blue end of the spectrum?

Empirical testing is of course the proof of the pudding, but given the number of variables it's bound to be a bit like 'testing' fishing flies, and I'd like my impressions to be backed up by laboratory explanations. For instance, I know that I like the tonality of Double-X in some situations, but not in others. If I could understand why, I could make informed decisions about when to use it or how to adapt the way I use it.
 

Mark J

Member
Joined
Mar 23, 2023
Messages
438
Location
Denbigh, North Wales UK
Format
Multi Format
I'm not sure what Mark's question about what happens if you feed white light into a diffraction grating is asking. If you're asking whether the grating itself has an efficiency as a function of wavelength, it certainly does. This efficiency is usually maximum at the blaze angle of the grating, so it can be controlled by the choice of spectrograph angles and blaze angle. It is necessary to calibrate this out as part of system efficiency to interpret the measurements.

You're correct of course. Thanks for the input. My work friend John gave me the info this morning, showing example plots from the Edmund Scientific gratings page. The efficiency is only optimum at the blaze wavelength, and probably drops off to about 60% to 70% at the ends of the visible spectrum if it was tuned for the green.
This now make it hard to complete the calculation, the fall-off could be a bessel function (?) but we can't be sure of what blaze wavelength was used by Ilford.
Damn !
 
Photrio.com contains affiliate links to products. We may receive a commission for purchases made through these links.
To read our full affiliate disclosure statement please click Here.

PHOTRIO PARTNERS EQUALLY FUNDING OUR COMMUNITY:


Ilford ADOX Freestyle Photographic Stearman Press Weldon Color Lab Blue Moon Camera & Machine
Top Bottom