Printalyzer - Darkroom enlarging timer & exposure meter

The Gap

H
The Gap

  • 4
  • 2
  • 43
Ithaki Steps

H
Ithaki Steps

  • 2
  • 0
  • 69
Pitt River Bridge

D
Pitt River Bridge

  • 5
  • 0
  • 77

Forum statistics

Threads
199,002
Messages
2,784,426
Members
99,765
Latest member
NicB
Recent bookmarks
2

albada

Subscriber
Joined
Apr 10, 2008
Messages
2,175
Location
Escondido, C
Format
35mm RF
I've used the easel meter from Darkroom Automation (@Nicholas Lindan) much, so I can provide a few clues based on that experience with my LED head. The DA meter:
  • can measure down to about 0.05 lux, which I've found is not quite enough, even with all three LED-chains running full power, forcing me to open up a stop or two to measure some highlights. 0.025 lux would be better.
  • integrates over a one-second period, thus updating the display every second. This is fast enough.
  • appears to have a fairly flat spectral response.
For B&W (lux) measurements, I don't think the spectral response of the sensor makes much difference because the LED-chains are at max, or with tungsten, the dichroic filters are out of the light path, so we are not measuring the actual green/blue colors that will strike the paper.

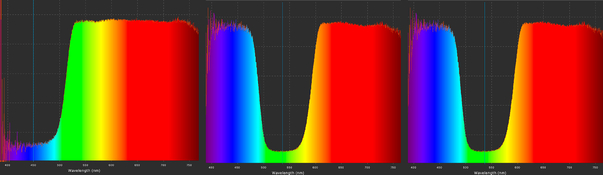
FYI, the LED heads built by myself, @Mal Paso, and @koraks (IIRC), use royal blue (~455 nm) and a normal green of ~525 nm. I have found that 455 nm yields maximum contrast from both Ilford and Foma papers. I remember reading a posting long ago from somebody who uses UV to get max contrast, but my tests show that's not necessary. And the lens probably isn't corrected for UV, so definition might suffer. For your sensor, I think going down to 450 will be fine. Does Ilford's #5 filter really have a peak at 400-420 nm? That's almost UV-A!

@koraks and I use a 660 nm red to be certain to avoid the red sensitivity in Foma papers (and it works well for RA-4).

When printing, I see little use for requirement #2 (measure green/blue for B&W) because the paper-tables "know" what effect filters or green/blue LED settings have on contrast (exposure range). Perhaps this feature would make calibration of paper + developer + filter-system easier.

A final twist: Apart from the common magenta cast, some films with some developers result in a light blue cast, which produces a noticeable shift in both exposure and contrast. I solved this problem by introducing a "bias" feature to the firmware in which green and blue brightnesses (PWM) are shifted by a given number of tenths of stops. Hmm, your requirement #2 could solve this problem automatically.

Mark
 

koraks

Moderator
Moderator
Joined
Nov 29, 2018
Messages
23,105
Location
Europe
Format
Multi Format
Or what wavelengths people who build RGB LED enlarger heads normally pick.

Mostly this, at this moment:

Blue: between 440 and 470nm.
Green: 525 nm.
Red: often 620nm, but if they're doing color work and have been paying attention, they will aim for 660nm 'photo red' (or maybe even higher!)

Integrated RGB LEDs (like the WS2812 etc.) virtually always use 465nm blue, 525nm green and 620nm red or something very close to these peak values (+/-5nm)

"red" is around 500-520nm (vaguely).

This puzzles me a bit; 500-520nm is cyanish-green. I never measured the cutoff of the cyan filter (which would be 'red'), but it'll be over 600nm. Or are you talking about the magenta filter? That also explains the "red/green" typo (?) earlier in your post.

Does enlarger baseboard metering of UV light have any value?

A little bit, but this may be increasingly relevant with the availability of high-power UV LEDs. People have (sparingly) been making UV enlargers for alt. processes and it's certainly something I see happening more of in the future.

Both the TSL2585 and TSL2591 might work fine for B&W, but I have doubts about their applicability as part of a baseboard measurement device for color work. I fear sensitivity at the extremes (blue & red) will be insufficient to get useful color resolution in those channels. That's just a hunch though; you'd have to do some experiments and then analyze the outcomes in comparison with the datasheets of both sensors to see where you might end up.
 
OP
OP
dkonigs

dkonigs

Subscriber
Joined
Sep 17, 2009
Messages
361
Location
Mountain View, CA
Format
Multi Format
My next step is to actually measure all these filters with a spectrometer. I'll be doing that as soon as I have the time to rig up something to hold the necessary equipment in place, either later this weekend or Monday at the latest. The data from that sort of test should answer most of the open questions here.

That being said, I should probably clarify what I was trying to do yesterday. Specifically, using the AS7343 sensor, I was primarily trying to answer the following two questions:
  1. Given that contrast is defined as a blue/green ratio (for an unspecified definition of "blue" or "green"), and given that the Ilford Multigrade filters change exposure when you jump from grade 3-1/2 to grade 4, can I take the ratio of two sensor channels and produce a smooth graph that directly corresponds to the contrast grade of the filter in use?
  2. Can I measure the effect of the dichroic adjustments on my enlarger light?
To answer question 1, I found that the only way to do this was to take the ratio of the sensor's F1 or F2 channels, divided by the sensor's F4 channel. This gave a nice smooth logarithmic curve. Any other combination had a dramatic bump when going from grade 3-1/2 to grade 4.

To answer question 2, I only got around to testing the magenta knob so far. But what I found was that the strongest relationship was with the F4 channel, followed by the F5 channel.

Here is the datasheet definition of what these channels correspond to:
(I've also been doing a lot of characterization with this sensor for my other project, and know the real values may vary slightly, but this is in the ballpark.)
1683994848265.png


Of course I know that the filters affect a broader spectrum than I'm discussing here, and that the paper's layers are also sensitive to a broader spectrum. At the time, I was mostly interested in my ability to accurately measure the materials in front of me.

P.S. Neither the TSL2585 nor the TSL2591 would be of any use for color work. But they might be a better/easier option for B&W work. Of course sensor choice here is still an open question, and its also possible that I eventually have multiple probes with different sensors. We'll see.
 

koraks

Moderator
Moderator
Joined
Nov 29, 2018
Messages
23,105
Location
Europe
Format
Multi Format
Given that contrast is defined as a blue/green ratio (for an unspecified definition of "blue" or "green"), and given that the Ilford Multigrade filters change exposure when you jump from grade 3-1/2 to grade 4, can I take the ratio of two sensor channels and produce a smooth graph that directly corresponds to the contrast grade of the filter in use?

Yes, that was also my reasoning when I was experimenting with a baseboard metering system. For B&W, it's the green-blue ratio, for color, it's the green-red and blue-red ratios combined that should in principle capture filtration. It's a gross simplification, but the basic principle that should work.

P.S. Neither the TSL2585 nor the TSL2591 would be of any use for color work.

Gotcha; we're on the same page on that one :smile:
 
OP
OP
dkonigs

dkonigs

Subscriber
Joined
Sep 17, 2009
Messages
361
Location
Mountain View, CA
Format
Multi Format
Okay, I just did my first round of spectrometer tests which yielded some interesting results...
For the Grade 0 through 3 filters, the dominant filtered ranges were centered on 430nm and 560nm.
For the grade 4 and 5 filters, that changes to 430nm and 530nm, and the shape of the curve changes a bit.
grade-2-vs-5.jpg


What was more interesting, is that the Grade 2 equivalent on my LPL enlarger (41Y+32M) looked quite different:
Grade2-41Y-32M.jpg


Also, when I tested the 3 knobs on my enlarger head to see what wavelengths they actually affected, I got something like this:
Screenshot 2023-05-13 at 3.00.14 PM.jpg


So what's my takeaway from this?

There are many spectra that can be used to achieve the same contrast grade result, as I suspected. And every kind of filtration or light source people use is going to be different.

So unless I'm able to both specially reconstruct the enlarger light, and compare it against the (unpublished) response curves of the printing paper, using a fancy sensor to calculate expected contrast from measured light is likely to be a lot more trouble than its worth.

It would certainly be possible to design an experiment that could figure out enlarger light settings to achieve a given contrast grade. But unless everyone is using light sources with the same emission spectra, being able to measure the color of the enlarger light is unlikely to be a useful feature.

Of course I could still detect which Ilford multigrade filter you left in the tray, but I don't think that has value beyond a nifty demo.
 

Attachments

  • Screenshot 2023-05-13 at 3.00.14 PM.jpg
    Screenshot 2023-05-13 at 3.00.14 PM.jpg
    180.6 KB · Views: 70
Last edited:
OP
OP
dkonigs

dkonigs

Subscriber
Joined
Sep 17, 2009
Messages
361
Location
Mountain View, CA
Format
Multi Format
Since I just realized that Ilford Multigrade paper sensitivity has a hard cut-off around 550nm, I decided to trim all my measured filter spectra there and show them side-by-side:
all-grades.jpg


From this, my takeaway is that the change in the center of the green filtering at the higher grades is not relevant. But still, note that the blue filtering is at a lower wavelength than many choose as their "blue" choice for LEDs.

Of course what none of this tells us is the actual response curves of the paper's two layers, or how that would interact with the different methods of producing colored enlarger light.
 

MattKing

Moderator
Moderator
Joined
Apr 24, 2005
Messages
53,098
Location
Delta, BC Canada
Format
Medium Format
Of course what none of this tells us is the actual response curves of the paper's two layers, or how that would interact with the different methods of producing colored enlarger light.

As I understand it, there are actually three components in Ilford's variable contrast papers: blue sensitive, green sensitive and cyan sensitive.
FWIW.
 

albada

Subscriber
Joined
Apr 10, 2008
Messages
2,175
Location
Escondido, C
Format
35mm RF
Thanks for posting these graphs. If you're using Ilford filters, you should have a 00 filter. It would be interesting to see where that 00 puts the green-blue cut-off.
 

Nicholas Lindan

Advertiser
Advertiser
Joined
Sep 2, 2006
Messages
4,248
Location
Cleveland, Ohio
Format
Multi Format
Three components, yes. Whether I'd simplify it to blue, green and cyan - no. They have a sensitivity to consecutively wider spectra.

"Blue" and "green" designations have been used for a long time. True, the "green" emulsion is sensitive to blue/nUV along with green, but you have to call it something that trips off the tongue. Another way to look at it is as a blue sensitive emulsion and an orthochromatic emulsion. The idea of a VC material made from a blue and ortho emulsion is pretty old - the sort of idea that comes while sitting in the garden on a Sunday afternoon.

As to "cyan," I'm afraid I may be guilty as the popularizer of that name. Have to call it something, and I have no idea what its sensitivity is but it seems, from the literature, to be a not-quite-ortho emulsion.

But, OK - any suggestions for new names.
 

koraks

Moderator
Moderator
Joined
Nov 29, 2018
Messages
23,105
Location
Europe
Format
Multi Format
But, OK - any suggestions for new names.

There's probably a tradeoff between accuracy and convenience (as always!)

Perhaps:
Blue-sensitive
Blue-cyan sensitive
Blue-green sensitive

What I feel is mostly problematic about the current terminology is that it does not capture the overlap between the different emulsions in terms of blue-sensitivity, while it is an essential property in understanding how VC papers work.

Of course, there's nothing wrong with calling it blue, green and cyan sensitive, unless the context requires more accuracy. This just happens to be one of those relatively rare cases where more accuracy really is needed.
 
OP
OP
dkonigs

dkonigs

Subscriber
Joined
Sep 17, 2009
Messages
361
Location
Mountain View, CA
Format
Multi Format
Thanks for posting these graphs. If you're using Ilford filters, you should have a 00 filter. It would be interesting to see where that 00 puts the green-blue cut-off.

Grade 00 follows the same progression as the Grade 0 through 3-1/2 filters. Here's the full range from ~400-600nm:
grade-00.jpg


And if I put it side-by-side with the rest, using a 550nm cut-off:
all-grades-1.jpg
 

albada

Subscriber
Joined
Apr 10, 2008
Messages
2,175
Location
Escondido, C
Format
35mm RF
Grade 00 starts at 450, and grade 5 ends at 500, so they overlap in 450-500. That makes me believe that either 00 isn't minimum contrast or 5 isn't max (or both). Or perhaps the differing pre-charges (or whatever the term is) for the emulsions means that, with tungsten light through a 5 filter, the blue-only emulsion is correctly exposed before the other emulsions have reached their pre-charge thresholds, and thus they contribute no low-contrast tone.
 

koraks

Moderator
Moderator
Joined
Nov 29, 2018
Messages
23,105
Location
Europe
Format
Multi Format
@albada correct me if I'm wrong, but there is also the possibility that some overlap in exposure might be necessary to reach dmax. At least, that's what I have observed (and I'm not alone in this) when exposing certain VC papers to pure green light in particular.
 

albada

Subscriber
Joined
Apr 10, 2008
Messages
2,175
Location
Escondido, C
Format
35mm RF
@albada correct me if I'm wrong, but there is also the possibility that some overlap in exposure might be necessary to reach dmax. At least, that's what I have observed (and I'm not alone in this) when exposing certain VC papers to pure green light in particular.

I agree. I regard pure green as useless because the curve takes too much exposure to reach Dmax (if it ever does). So my lowest-contrast setting includes a small amount of blue to shorten that long shoulder.
 

koraks

Moderator
Moderator
Joined
Nov 29, 2018
Messages
23,105
Location
Europe
Format
Multi Format
I regard pure green as useless because the curve takes too much exposure to reach Dmax (if it ever does)

Exactly; by the time you ever come close to a good black, there will be so much halation & blooming that the image is effectively useless. Coincidentally, this very problem (halation) was a major part of the challenge of transitioning RA4 papers towards digital exposure - but I digress.
 
OP
OP
dkonigs

dkonigs

Subscriber
Joined
Sep 17, 2009
Messages
361
Location
Mountain View, CA
Format
Multi Format
Okay, so I think I've finished a (hopefully) sufficient round of actually testing these sensors for low-light sensitivity. The test involved using their respective evaluation boards, which was mostly just the bare sensor. (though the TSL2585 one had an opaque diffuser built in) In any case, assume this is the best case scenario for sensitivity, and a real world full-up metering probe will collect a bit less light.

For the test I had my enlarger (~3000K halogen light, diffusion) at a reasonably high height, dialed in some neutral density on the color head, and set the lens to f/16. This was an amount of light that read <0.0 lux on my calibrated lux meter. (it only goes to one decimal)

For the sensors, I set them to maximum gain and 100ms integration time. I figured this was a good baseline. I'm not sure what I'll use in practice, but its possible I'll average across multiple integration cycles.

The goal was to see if I could distinguish between "enlarger off" and "enlarger on", and how many raw counts of difference there would be in the scenario.

The results:
- TSL2591: ~100 off, ~200 on
- TSL2585: ~300 off, ~600 on
- AS7343: ~3 off, ~14 on

At this point, I think the TSL2585 is probably the sensor to go with. It has the most "correct" response curve for the standard I'm trying to measure against, its the newest of these sensors, its actually the cheapest (by a few cents), and is also fairly sophisticated. (I'll learn a lot more about how to use it effectively with experience. Also, quick glance at the datasheets would make one think the TSL2591 should be more sensitive, but their footnotes show different test conditions.)

If I want to do anything that requires color measurement, however, I'm going to need to make a probe with the AS7343. But the amount of calibration necessary to make that useful could end up being more trouble than its worth.

One thing I should mention... Even if you don't care to actually meter your print exposures, having the meter as part of the setup still has value. It allows you to calibrate your enlarger's turn-on/turn-off behavior, which leads to far more consistent exposure times across adjustments. This is a good thing to have when your exposure times are short, or if you like to do timer-controlled patches on your test strips.
 

koraks

Moderator
Moderator
Joined
Nov 29, 2018
Messages
23,105
Location
Europe
Format
Multi Format
That sounds like a very reasonable and quick pre-selection round.

But the amount of calibration necessary to make that useful could end up being more trouble than its worth.

It'll be challenging to get right. I can't really gauge the market potential for this - I do know that ColorStar analyzers sell fairly easily and for sweet sums of money. But it's a small market, still.
 

albada

Subscriber
Joined
Apr 10, 2008
Messages
2,175
Location
Escondido, C
Format
35mm RF
For the test I had my enlarger (~3000K halogen light, diffusion) at a reasonably high height, dialed in some neutral density on the color head, and set the lens to f/16. This was an amount of light that read <0.0 lux on my calibrated lux meter. (it only goes to one decimal)

Did you try opening the lens a few stops when taking lux measurements, and dividing-down the result? That might yield a decent value.
 
OP
OP
dkonigs

dkonigs

Subscriber
Joined
Sep 17, 2009
Messages
361
Location
Mountain View, CA
Format
Multi Format
Did you try opening the lens a few stops when taking lux measurements, and dividing-down the result? That might yield a decent value.
Assuming we trust the aperture blades of the enlarger lens, that gives me an approximate value of 0.056 lux for the above test.

I should mention that the sensor's datasheet claims it can detect all the way down to 1 mlux. Of course there will be some sort of diffuser on top, so realistically I'd expect to not do quite that good. However, given that I seemed to achieve ample range with 100ms integration time (a setting I can always crank up), I think I'm in a good place.
 

albada

Subscriber
Joined
Apr 10, 2008
Messages
2,175
Location
Escondido, C
Format
35mm RF
Assuming we trust the aperture blades of the enlarger lens, that gives me an approximate value of 0.056 lux for the above test.

I should mention that the sensor's datasheet claims it can detect all the way down to 1 mlux. Of course there will be some sort of diffuser on top, so realistically I'd expect to not do quite that good. However, given that I seemed to achieve ample range with 100ms integration time (a setting I can always crank up), I think I'm in a good place.

0.056 lux is about the same as the 0.05 minimum of the Darkroom Automation meter.
The 2585 was 300 counts above noise, and 1/4th of that (75 counts) yields okay accuracy, giving you two more stops.
And integrating over 400ms instead of 100 is another two stops.
With four more stops (or around three more with a diffuser), you have plenty of headroom.

BTW1: The DA meter has no diffuser.

BTW2: Tungsten has relatively little blue, and the 2585's spectral response imitates the human eye, which is weak in blue and near-IR. Combining those two will yield a system that measures mostly green-to-amber. I see no harm in that, but it's good to keep in mind.

Mark
 
OP
OP
dkonigs

dkonigs

Subscriber
Joined
Sep 17, 2009
Messages
361
Location
Mountain View, CA
Format
Multi Format
BTW1: The DA meter has no diffuser.
Its hard to see whether there's any sort of protective cover on top of the sensor, from what few photos I can find online.
For my own implementation, I'm not sure if I'll use an actual white diffuser, or simply stick to a blurry translucent patch on a polycarbonate graphic overlay (what I've done before) that only scatters a little bit. The later is, of course, easier to assemble.

BTW2: Tungsten has relatively little blue, and the 2585's spectral response imitates the human eye, which is weak in blue and near-IR. Combining those two will yield a system that measures mostly green-to-amber. I see no harm in that, but it's good to keep in mind.
Yeah, I'm aware of this. The general idea is that the light you meter under, and the light you expose under, don't actually have to be the same. The paper profiles you generate represent the relationship between "measured white unfiltered light" and "paper density after exposure under contrast filtered light."

For conventional enlargers, this approach works quite well.

If you're using an LED enlarger, I'd just need to make sure that different settings go to the LEDs in "focus mode" versus "exposure mode".
 

albada

Subscriber
Joined
Apr 10, 2008
Messages
2,175
Location
Escondido, C
Format
35mm RF
Its hard to see whether there's any sort of protective cover on top of the sensor, from what few photos I can find online.
Here's the sensor used in my DA meter. Click on this thumbnail for a large image.
MeterSensor.jpg
I don't see a diffuser over it. And FWIW, I've noticed only insignificant fall-off from center to corner on the easel.

For my own implementation, I'm not sure if I'll use an actual white diffuser, or simply stick to a blurry translucent patch on a polycarbonate graphic overlay (what I've done before) that only scatters a little bit. The later is, of course, easier to assemble.
You cannot avoid cosine fall-off, so the purpose of a diffuser would be to eliminate sensor fall-off.

Yeah, I'm aware of this. The general idea is that the light you meter under, and the light you expose under, don't actually have to be the same. The paper profiles you generate represent the relationship between "measured white unfiltered light" and "paper density after exposure under contrast filtered light."

For conventional enlargers, this approach works quite well.

If you're using an LED enlarger, I'd just need to make sure that different settings go to the LEDs in "focus mode" versus "exposure mode".

You will need to SHOUT to everyone, "Meter under white focus-light, not filtered light." Despite your shouting, I'm afraid many folks will meter under the wrong light.
On my LED-head controller, I labeled the button "White" (instead of "Focus") because it's used for composing, focusing, and metering.

Mark
 
OP
OP
dkonigs

dkonigs

Subscriber
Joined
Sep 17, 2009
Messages
361
Location
Mountain View, CA
Format
Multi Format
You will need to SHOUT to everyone, "Meter under white focus-light, not filtered light." Despite your shouting, I'm afraid many folks will meter under the wrong light.
On my LED-head controller, I labeled the button "White" (instead of "Focus") because it's used for composing, focusing, and metering.
I know I'll need to say this prominently. Somehow, I think I'm going to have to shout it 10x as loud as everyone else.
Many other analyzers work this way, including the Heiland Splitgrade, the RH Analyser, and the DA Enlarging Meter. They all mention it in their respective manuals, but get away with not printing it in a huge font on a yellow background. Rather, they just mention it in the list of steps for various common operations.

Of course this approach does make sense, given a decent set of paper profiles. It has two big benefits:
  1. The meter receives more light exposure when doing its thing.
  2. You can adjust your contrast setting without having to redo your metering.
The only way to get around this "limitation" would be to use a fancy multi-spectral sensor and also build a model of the contrast filters. That way you could figure out which one is in use, and mathematically "undo" its effect on meter readings. It makes everything more complex, more error prone, and on top of that you'd need to use a sensor less able to handle the dimmer lighting conditions caused by such filters.
 
OP
OP
dkonigs

dkonigs

Subscriber
Joined
Sep 17, 2009
Messages
361
Location
Mountain View, CA
Format
Multi Format
Okay, its probably a good time to share some proof of progress :smile:
I've finished assembling the circuit boards for the next round of prototypes, so here they are:

First, the final view of the main board fully ready and running:
PXL_20230612_045330515.jpg


Here's the other side of the main board (partially assembled), and the power board (fully assembled):
PXL_20230609_213359609.jpg
PXL_20230607_223605963.jpg


And finally, the board for the metering probe:
PXL_20230608_192802326.jpg


The enclosure these boards will be going in is due to ship in a few days, after which I'll have something that looks a bit more like a real piece of equipment. :smile:

The new enclosure for the meter probe is still a work-in-progress, though I've 3D printing at least one of them so far:
PXL_20230608_213512812-1.jpg

(Of course the real version will be higher quality, and will have professional made graphic overlays on top. Right now its more about getting something in place so I can start working on the code to actually run the new sensor and do some experiments with diffusers.)
 
Photrio.com contains affiliate links to products. We may receive a commission for purchases made through these links.
To read our full affiliate disclosure statement please click Here.

PHOTRIO PARTNERS EQUALLY FUNDING OUR COMMUNITY:


Ilford ADOX Freestyle Photographic Stearman Press Weldon Color Lab Blue Moon Camera & Machine
Top Bottom