Stephen Benskin
Member
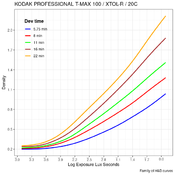
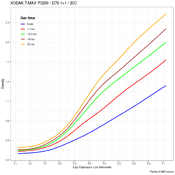
I think this falls under the general umbrella of methodology and the characteristic curve analysis. I found some interesting looking curves in Kodak's PDF document F-4001, which concerns the T-MAX P3200 film. On page 8, the characteristic curves appear to be wrong. I am attaching them here. They seem to be more for an ISO 100 film, rather than the ISO 1000-1200 that the P3200 appears to be. Another small issue is the very low B+F density, which appears to be significantly lower than the current 135 version of the film. This is not a big deal, but I thought it was interesting. I wonder if this was just an innocent mistake, and, if so, how it ended up in the wrong document.
You might be misreading the notation. -2.50 vs bar 2.5
Last edited:


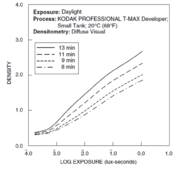
 ), I compared those curves to those in the PDF for T-MAX 100, and I think they are the same curves. It might be that someone simply pasted the wrong curves into the document before it was published. I hope the person didn't get in trouble for that. It was probably an innocent mistake. Here's the T-MAX 100 page (p. 8) from the PDF (F-4016):
