Hiding in Plain Sight

about to extinct

D
about to extinct

  • 1
  • 0
  • 67
Fantasyland!

D
Fantasyland!

  • 9
  • 2
  • 123
perfect cirkel

D
perfect cirkel

  • 2
  • 1
  • 125

Recent Classifieds

Forum statistics

Threads
198,748
Messages
2,780,337
Members
99,694
Latest member
michigap
Recent bookmarks
1

Chuck_P

Subscriber
Joined
Feb 2, 2004
Messages
2,369
Location
Kentucky
Format
4x5 Format
Personally, I don’t think there’s enough included in those two paragraphs to make any conclusions on the viability of any methodology.

You may be right, but I don't care; it's not important to me.

Once again, I never emphasized a lack of viability of using CI, not once, only that it's not useful to me in my use of the ZS (after all that's the way I learned it), despite the misgivings you have about it. CI values themselves have no bearing on any decision I make, that has been my only sentiment. I've no good reason to start considering it the way you and Bill do given the personal success I'm having after never really thinking about it at all. Call that mindset what you will, it's irelevant. I see that it is enormously important in the way that you and Bill and I guess others operate, but not for me in the way I operate----you seem to have a hard time accepting that. I regret ever mentioning it all.
 
OP
OP
Stephen Benskin
Joined
Jan 7, 2005
Messages
2,612
Location
Los Angeles
Format
4x5 Format
Michael, I'll try to touch on some of these questions.

When I do these white card tests I meter with the same 1deg spot meter I use in the field, keeping as close to the lens axis as possible. I don't know if there is any flare in the metering, or the camera exposures. Based on previous responses from you and Bill Burk to similar questions, I assume flare to be minimal in my tests.

Yes, I would considered it virtually flare free.

I use a brightly lit white card and expose in camera to determine EI (admitedly this probably ends up understating EI, and that is borne out when I go to the "outside the lab" tests).

It's not as much about the white card as it is about interpreting the results from a flare free test. Remember the thread about the relationship between the speed point and the metered exposure point? The reason why the ISO speed point is only 1.0 logs from the metered exposure point while the scene luminance range between the metered exposure and the shadows is 1.3 log is because you are projecting the effective shooting conditions onto a no flare test. Flare reduces the range from 1.3 to 1.0 or to put it another way, flare increases the film speed from where it would be without it. The higher the flare factor, the faster the effective film speed.

2. I plot a curve from threshold up to zone XV, the reason being I'm often dealing with very long SBRs in my work. This is why I feel it is important to know the shape of the curve, all the way up to zones XIV-XV under different development scenarios - not understanding that part of the curve and how variable it is, is where many people go wrong with severe contractions, stand development etc.

However I am still unclear on things like - what constitutes a high flare vs low flare situation?

It's more likely from your experience, you know more about flare in extreme situation than almost anyone else. Many of the more normal conditions likely to be experienced tend to fall into predictable rules and categories of scene types and lighting conditions. Most of which I am rusty on. There are a few papers by Loyd Jones that cover much of this in detail. All three of them were published in The Journal of the Optical Society of America. They are listed chronologically and they are:

The Brightness Scale of Exterior Scenes and the Computation of Correct Photographic Exposure.
Sunlight and Skylight as Determinants of Photographic Exposure. I. Luminous Density as Determined by Solar Altitude and Atmospheric Conditions.
Sunlight and Skylight as Determinants of Photographic Exposure. II. Scene Structure, Directional Index, Photographic Efficiency of Daylight, Safety Factors, and Evaluation of Camera Exposure.

The first and third paper deal more directly about what you are interested in. They are a tough read. I probably should review them too. If I run across anything I think will be helpful, I'll post it.

On the average, the shorter the luminance range the lower the flare factor and vice versa. Flare tends to act like a buffer with the degree of processing. You don't have to reduce development as much with scenes with a large luminance range and you don't have to extend the processing as much with scenes with shorter luminance ranges than would be indicated without factoring in flare. Then there's the whole perception of the finished image. If the shot is toward the sun, the viewer will expect for the shadowed areas to be hazy. I believe the third Jones paper covers much of this.

Michael, This is a really big subject. Maybe if the questions are a little bit more specific or something, I could be more specific with my answers.

To me the last graph you posted (post #131) is really what it all comes down to when we talk about flare. This is really the kind of "flare overlay" we all need when we plot curves. The question is, how? It is too variable.

That graph isn't really how flare works on the film curve, below is how it really works.
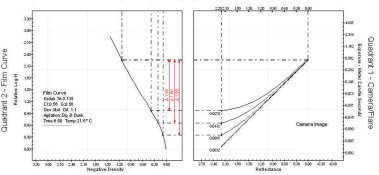
Two Quad - Multi flare.jpg

Now, you don't need a camera image / flare curve to make it work. Simply use the exposure range from combination of the scene's luminance range and flare and apply it to the film curve. It sounds like you are already doing this.

Is flare too variable to have to do this? Yes and no. Yes, no matter what it's always going to be a guesstimate. No in that phenomenon tends to have statistical averages and follow a bell curve, so you have a better chance to be within your target range if you factor some of it in.

Odds are you are already factoring it in depending on how you measure the film. This is something I've discussed ad infinitum. The manufacturer's published processing times have flare factored in too. So most people incorporate flare into their film processing whether they know it or not. And if you are already incorporating a stop of flare into your process, and if the flare factor is plus or minus another stop or so, this difference can easily be off-set by a variety of factors like scene luminance range, the nature of the subject, how the tones are distributed, choice of paper grade, and personal taste.

Didn't I recently say something about why Kodak might use a fix flare model for their contrast determination instead of the more realistic variable flare model? The question comes down to how accurate does a model have to be. Understanding theory is not only about attempting to achieve a level of control over the process. It's about understanding the process in order to know the degree of what can and cannot be controlled.

And how is that flare impacted by the choice of lens, luminance placements, exposure time etc?

Another question that could be the topic for a whole new thread. Off the top of my head - Lens? Angle of view, coated or uncoated, size of image circle, number of elements, etc. Distribution and size of scene luminance? Absolutely, much of first and third Jones paper is on that topic. Exposure time? I'm not sure but it doesn't seem like it should. I'll have to keep an eye out for that one.

Sorry if this post comes off as disjointed and rambling.
 
Last edited by a moderator:

Bill Burk

Subscriber
Joined
Feb 9, 2010
Messages
9,290
Format
4x5 Format
Chuck,

Your curves showing HC110 and D-76 clearly show how meaningful it is to compare curves in their entirety.

But the corollary was not true, the line between two points does matter in classic ZS, so I had to say something.

You already got my drift and responded and I'm good with that.

I'm not going to tell you to change your NDR, though I continue to explore the interesting fact that you chose 1.2 and I chose 1.0

For the amusement of all, Minor White aimed for NDR 1.5
 

Chuck_P

Subscriber
Joined
Feb 2, 2004
Messages
2,369
Location
Kentucky
Format
4x5 Format
Chuck,

Your curves showing HC110 and D-76 clearly show how meaningful it is to compare curves in their entirety.

But the corollary was not true, the line between two points does matter in classic ZS, so I had to say something.

You already got my drift and responded and I'm good with that.

I'm not going to tell you to change your NDR, though I continue to explore the interesting fact that you chose 1.2 and I chose 1.0

For the amusement of all, Minor White aimed for NDR 1.5

Bill, I tried to paraphrase my statement regarding gradient as viewed in The Negative that Stephen previously highlighted, didn't do a good job I guess. I can't determine that the line connecting points on the curve to determine gradient matters in the classic approach to the ZS, but would be inerested in your point.

When I learned the ZS, I chose 1.2 because that was indicated by AA in the text, for no other reason than that. It's working so well, I've not a good reason to deviate from it. I understand more today about gradient and CI, because of these threads, but not enough to cause me to change it.
 
OP
OP
Stephen Benskin
Joined
Jan 7, 2005
Messages
2,612
Location
Los Angeles
Format
4x5 Format
(again in Adams, but in other books too) that a film with a relatively "long toe" is generally more useful under low flare conditions such as those encoutered in studio work. Why would this be? To me it seems the opposite.

As you know, flare reduces contrast in the lower parts of the film curve. The higher flare in exterior scenes with a shorter toed film will create the same basic curve shape in the toe as a long toed film shot under controlled studio lighting. Long toed films also generally have an up sweep in the higher densities which is desirable for skin tones in portraiture.

From your descriptions, it sounds like your observations are supported by theory. Have you found the safety factor that higher flare gives you in those extreme conditions a help or hindrance?
 
OP
OP
Stephen Benskin
Joined
Jan 7, 2005
Messages
2,612
Location
Los Angeles
Format
4x5 Format
Interesting question. I can't really say whether it helps or not, because I am basically adjusting for it in printing, whether or not I realized it in the past. Thinking about it, I don't see how flare can really help in any of my work. While flare can raise the effective EI, it lowers local contrast in shadow areas. For me EI is nothing in and of itself. It is simply a way for me to make sure my shadow densities are on the straight line, so that the local separations are good. If flare flattens that part of the curve, what do I care if it raises my EI? I'm still a net loser from a tonal perspective. In fact, if films had longer scales extending up to say zone XX, I might even argue given a high flare scene it would be better to lower your EI by several stops so that the shadow values are past the most flare-impacted portion of the curve.

Here are a few more things to consider. You don't have to reduce the processing as far with flare as without, so the average gradient is higher than it would be without flare. Flare doesn't actually flatten out the toe. It compresses the exposure in the shadow area and moves it to the right on the curve. The shifting of the exposure off the toe actually reduces the compression to a degree. To begin to understand the way it’s all perceived, you have to turn to the topic of subjective tone reproduction. That will make your head spin.

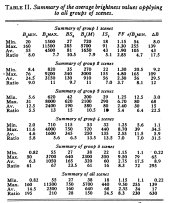
I found something in Jones’ Brightness Scale paper that speaks to your question about flare in various situations. There were a predominance of front lit scenes used in the testing. That means the data set contains a more limited luminance range and range of flare than can potentially be encountered. He divided scenes into four subdivisions: 1) distant, 2) remote, 3) near-by and 4) close-up.

1). Distance – Landscape
2). Remote – They use a street scene as an example
3). Near-by - They use a single house
4). Close-up - The example shows a full shot of a boy sitting down.

Jones writes, “It is interesting to note that the average Bmin (min luminance) value decreases progressively and in an orderly manner from groups 1 to 4, inclusive. The average brightness scale (range) increases progressively in these groups.

The flare factor increases systematically from group 1 through 2 and 3 and 4. The value of delta B (luminance) however, decreases progressively from group to group. These two facts taken together mean that while, in general, a distant open landscape results in a higher absolute value of flare light on the focal plane, its effect in reducing the illumination scale (range) of the image is less than in the case of a group 4 scene. This follows from the fact that the shadow brightness (luminance) of a group 4 light results in a greater proportionate reduction of the illumination scale (range) of the image corresponding to an increase in the flare factor.”


And later, “It will be seen that the flare factors vary enormously from scene to scene. This variation is due largely to the variable brightness (luminance) distribution found in these scenes and in their environments. From the summary of the entire group at the bottom of Table II, it will be seen that the flare factors vary from 1.15 to 9.50.”


If you want to know what that is in log-H, simply convert it to logs: log(9.5) = 0.98 or 3 ¼ stops.

I like the idea of the degree flare effects the image depends on the minimum luminance value. Darker tones from distant scenes will arrive at the camera lighter because of atmospheric haze and something called the blending distance. The effects of flare have little effect that high on the film curve.

“The average flare brightness scale (luminance range) also increases progressively through these four groups and, as a matter of fact, there is a good correlation between the average flare factors and the average brightness scales (luminance ranges).”

Some of the Summary

“1. The maximum and minimum brightness (luminance) of 126 exterior scenes of a wide variety of types has been measured. Form these data it is found that the average brightness scale (luminance range) is 160.

3. For the average type of small portable hand camera used predominantly in the amateur field, the average value of the flare factor is approximately 4.0. This value is based on a large mass of statistical evidence not published as a part of this communication. For the equipment used predominantly in the amateur field, therefore, the average value of image illumination scale (illuminance / exposure range) is 40.”


A 160 luminance range is 7 1/3 stops or 2.20 logs. A flare factor of 4.0 is two stops. Coated lenses cut the value in half.

Below is Table II.
B min and B max – minimum and maximum luminance value in footlamberts.
BS – Luminance range
IS – Illuminance or exposure range - if no flare is present IS will equal BS
FF – Flare factor

Jones Brightness Range - Table II.jpg
 

Bill Burk

Subscriber
Joined
Feb 9, 2010
Messages
9,290
Format
4x5 Format
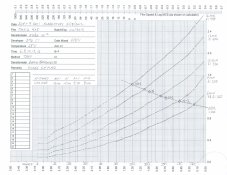
I have created an unusual graph that on the surface looks like any other curve family.

This curve family includes 0.4 fixed flare (dashed lines are flare-influenced), and shows my target 1.00 Negative Density Range (solid line that slopes about 20-degrees downward).

The low densities Zone I and Zone II are not precisely predicted in this graph so they are horizontal dotted lines. For this first iteration I picked Zone II as the anchor for the influence of flare.

flarestudy.jpg
 

Bill Burk

Subscriber
Joined
Feb 9, 2010
Messages
9,290
Format
4x5 Format
To see where it came from, this is the curve family without flare.

http://beefalobill.com/imgs/Sept9TMY2.pdf

To get the flare "curve" you turn the Log numbers to mathmatical values.

At the speed point for ASA 400, the Log value is -2.7 (as used on a calculator with log functions) which translates to mathematical 0.002 mcs (meter-candle seconds). The amount of light that hit the film in non-flare conditions.

Stepping over to the right 0.4 log units is the speed point for ASA 160, Log is -2.3 translates to mathematical 0.005 mcs. The amount of light estimated to hit the film when flare becomes involved.

Amount of light estimated to hit the film minus amount of light that would have hit the film without flare, 0.005 mcs - 0.002 mcs = 0.003 mcs added to the entire sheet of film due to flare.

To graph flare, then becomes a simple graphing task.

For every data column, get the mathematical mcs number, add 0.003 mcs to it. Convert it to Log to find the actual mcs that would have arrived at that column. Then using the actual curve family for each dot of the plot, take the dot from the graph underneath the new column.

So I started with the nearest data column to the ASA 400 speed point, the speed point for ASA 250, -2.5 Log mcs, 0.003 mcs.

0.003 mcs non-flare exposure for that column + 0.003 mcs flare over the whole sheet of film = 0.006 mcs exposure really hit the film under the speed point for ASA 250. This is -2.22 Log.

Thus on the graph for the column under the ASA 250 speed point, instead of plotting the test results, I use the plots from under the effective exposure that I find on the non-flare curve family graph under -2.22 log.

The boring process is repeated: For each data column mcs, add 0.003 mcs for flare, find the Log and then look at the non-flare curve family and take the points from that column. Basically the non-flare curve family graph tells you exactly what density you get when you hit the film with a certain amount of light.

For the flare study you try to estimate how much light would hit the film in a camera when flare is involved. So where you expected Zone II you get Zone II + 0.003 mcs which is pretty significant on the toe. It starts to get down to no effect as you go higher, for example there is less than 0.1 Log flare at Zone IV (0.015 mcs) + 0.003 mcs = 0.018 mcs.

I hope to be able to take this flare study curve family to the field and use it for planning exposure and development, and have a reasonable expectation that the negative densities will fall where I placed the metered exposures. This wasn't happening for me when I used non-flare curve family. I was getting greater densities in the Zone II than I predicted.

This chart is how I plan to deal with flare. I expect process variation, errors and other realities to cause +/- 0.10 density of what I aim for.

Other ways of dealing with flare can get you just as close. For example, Chuck, I bet your N-times for TMY-2 are very close to mine even though I aim for 1.00 NDR and you aim for 1.20 - the difference is very close to the effect of flare.
 

Chuck_P

Subscriber
Joined
Feb 2, 2004
Messages
2,369
Location
Kentucky
Format
4x5 Format
I hope to be able to take this flare study curve family to the field and use it for planning exposure and development, and have a reasonable expectation that the negative densities will fall where I placed the metered exposures. This wasn't happening for me when I used non-flare curve family. I was getting greater densities in the Zone II than I predicted.

This chart is how I plan to deal with flare. I expect process variation, errors and other realities to cause +/- 0.10 density of what I aim for.

Other ways of dealing with flare can get you just as close. For example, Chuck, I bet your N-times for TMY-2 are very close to mine even though I aim for 1.00 NDR and you aim for 1.20 - the difference is very close to the effect of flare.

Bill, I can identify somewhat----

I've had times when checking post-processing negative densities relative to the shadow placement that they were so close to what was expected and at times they have not been. I admit early on in my understanding that I was not sure why this was so----why some densities were very satisfactory for one negative and while some seem too far off for another, although not really to the detriment of the the integrity of the actual shadow density. Meaning, most always the added low value density could be 'printed through', yes, a phrase I gleaned from AA. I came to realize that because it was not a consistent thing and that it was subject related, that lens flare was the cause. So, doing my own simplified approach to it i.e. a little web searching and referencing my own materials, I came to view it as just like pre-exposure in it's affect as discussed in The Negative. I make attempts to compensate for potential higher flare situations when I can, that is to reduce exposure to the negative to some degree to protect the toe of the curve as much as possible.

Regarding the TMY-2, I haven't used it, but want to eventually test with it, but if you had some results for TMX in d-76 1:1, perhaps a comparison could be made.
 

Bill Burk

Subscriber
Joined
Feb 9, 2010
Messages
9,290
Format
4x5 Format
...I came to view it as just like pre-exposure in it's affect as discussed in The Negative. I make attempts to compensate for potential higher flare situations when I can, that is to reduce exposure to the negative to some degree to protect the toe of the curve as much as possible.

That is a good way to visualize it.

Regarding the TMY-2, I haven't used it, but want to eventually test with it, but if you had some results for TMX in d-76 1:1, perhaps a comparison could be made.

I haven't done a whole curve family, but I hit a little above N in 11:15 minutes in D-76 1:1

Our times are different but the curve characteristics are similar. So I believe there is a process difference. I use open trays and shuffle several sheets, my times tend to run longer than others'
 
Last edited by a moderator:

Bill Burk

Subscriber
Joined
Feb 9, 2010
Messages
9,290
Format
4x5 Format
In fact, if films had longer scales extending up to say zone XX, I might even argue given a high flare scene it would be better to lower your EI by several stops so that the shadow values are past the most flare-impacted portion of the curve.

I don't think it works that way...

In a really long-scale scene that includes Zone XX, flare is probably up around Zone IX.
 

Bill Burk

Subscriber
Joined
Feb 9, 2010
Messages
9,290
Format
4x5 Format
Bill, I didn't mean the SBR went that high, but rather that the film had a straight line that went that far - in other words, more lattitude. So if I had a high flare subject with say a 10 stop SBR, I could place the lowest values high enough on the curve (say zone V or VI) so that they would lie to the right of the portion of the curve most affected by flare. In other words all the subject values would be to the right of the portion of the curve where flare-induced local contrast compression is most pronounced.

Obviously it was just hypothetical though, and only from the perspective of tonality, forgetting about the resolution and sharpness downsides to high exposure placements.

I see what you mean. My curves don't go out that far. But the flare overlay isn't part of the film characteristics - it's part of the exposure. If you shift the exposure, you shift the flare.

Steve has been talking about the idea that once you have a great range like 10 stop SBR, flare probably works in your favor by shortening the negative density range.
 

Bill Burk

Subscriber
Joined
Feb 9, 2010
Messages
9,290
Format
4x5 Format
I'm going to have to sit down and think about this some more. If my hypothetical example is false I'm still missing something here.

Also, as I said in an earlier response to Stephen's question regarding whether the flare is helping with a long SBR, I don't see why it is helpful, other than because you don't need to reduce development quite as much. It shortens the negative density range, but who cares about that if local contrast in the lower values is compressed?

Right. It helps keep your negative able to print on paper. So in a sense it is working in a favorable direction. But flare doesn't necessarily improve the picture.

Well. I am rethinking my position on whether flare hurts pictures. I've discarded a couple cameras with uncoated optics that gave me high-flare pictures. Now I appreciate the esthetics and have my regrets.
 
OP
OP
Stephen Benskin
Joined
Jan 7, 2005
Messages
2,612
Location
Los Angeles
Format
4x5 Format
And this is once of the most important things most people miss, not only regarding flare, but regarding the negative and printing in general. All this stuff about fitting the negative range onto the paper, that doesn't make the difference between a crap print and a fine print at all.

It's just like owning a ton of expensive equipment doesn't guarantee a good photograph. They are simply tools. When I worked in a lab, people would call up and ask what film Herb Ritts or some other client shot. Like shooting the same film would make a difference.

Also, as I said in an earlier response to Stephen's question regarding whether the flare is helping with a long SBR, I don't see why it is helpful, other than because you don't need to reduce development quite as much. It shortens the negative density range, but who cares about that if local contrast in the lower values is compressed?

No one desires to have a lot of flare but there are some advantages when it is in moderation. There's a average flare today of around one stop, and before lens coatings, two stops. This encompasses the entire history of photography. Most people aren't even aware that any exists. So, it obviously isn't disastrous.

Film speeds would be one stop slower without flare. For proof, simply look at the EI values that come from Zone System testing (no flare testing and not factoring in flare during speed determination), and ISO speeds.

Now, we can compare the difference in effective film gradients between a film curve without flare and with flare and point out the compression of the tones from flare. But that doesn't tell the whole picture. It doesn't take certain other factors into consideration. Chief among them is what we perceive when we look at an image. I'm not talking about if a person can see the difference in tonal separation but what is considered a good print. Even if it were possible, an ideal print with a 1:1 tonal relationship with the original subject wouldn't be considered pleasing. In reality, camera flare reduces the shadow contrast and enlarger flare compresses the highlight, but that's okay, because as long as the mid-tones are printed slightly more contrasty than the mid-tones of the original subject, the resulting print is considered to have a certain level of quality.

There are many more factors that are involved and considered including personal preferences, subject matter, and printing choices. But with careful testing a statistical model can be determined. Of course, it doesn't speak to the creative interpretation of a subject but about what generally will tend to yield more consistent high quality prints.

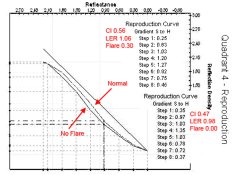
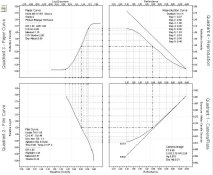
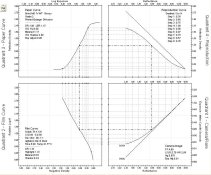
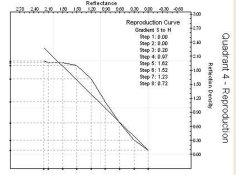
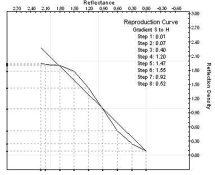
In the example below, the two tone reproduction curves that will give potentially good subjective tone reproduction prints. One can be considered coming from the classic set of conditions, average luminance range, one stop flare, CI 0.56, and a paper LER 1.05. The other is from the same luminance range range, no flare, CI 0.47, and a paper LER of 0.98.

Tone Reproduction Curve - flare and no flare.jpg
 
OP
OP
Stephen Benskin
Joined
Jan 7, 2005
Messages
2,612
Location
Los Angeles
Format
4x5 Format
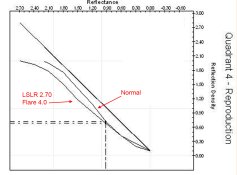
My point is just that the film is only part of the photographic process. The tone reproduction curve in quadrant four takes into consideration paper, exposure, camera image, and the original scene. Below are the two complete tone reproduction diagrams that were use for the example in post #156. I'm going to post another example of a 9 stop luminance range with two stops flare a little later.

Normal four quad.jpg Normal no flare.jpg
 
Last edited by a moderator:

Bill Burk

Subscriber
Joined
Feb 9, 2010
Messages
9,290
Format
4x5 Format
...One can be considered coming from the classic set of conditions, average luminance range, one stop flare, CI 0.56, and a paper LER 1.05. The other is from the same luminance range range, no flare, CI 0.47, and a paper LER of 0.98.

View attachment 46805

So I assume the "non-flare" curve is not realistic?

I have been interested recently in the fourth quadrant curve of the "preferred" curve - that the 45-degree angle perfect curve is actually not attractive and there is a curve that is psychologically preferred. You may have shown that in recent posts? As I recall it is up and to the right of the 45-degree line but similar to your "normal" curve here. Is that right?
 
OP
OP
Stephen Benskin
Joined
Jan 7, 2005
Messages
2,612
Location
Los Angeles
Format
4x5 Format
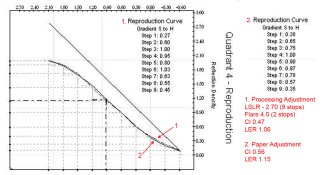
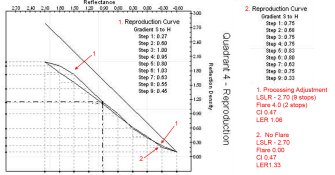
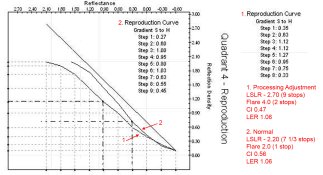
Here are three more tone reproduction curve comparisons. They are:

Comparing Film Processing Adjustment and Paper Contrast Adjustment
LSLR: 2.70 (9 stops)
Flare: 4.0 (2 stops)
Exposure Range: 2.10

LSLR 9, 2 stops flare, processing adjusment and paper adjustment.jpg

Comparing Film Processing Adjustment and Film and Paper Adjustment with a No Flare Curve
Exposure Range for 4.0 flare: 2.10
Exposure Range for zero flare: 2.70

LSLR 9, 2 stops flare, processing adjusment and no flare.jpg

Comparing Statistical Normal Conditions with Film Processing Adjustment Example
Normal Conditions:
LSLR: 2.20
Flare: 2.0 (1 stop)
Exposure Range (1.90)

Film Adjustment Conditions:
LSLR: 2.70 (2 stops)
Flare: 4.0 (2 stops)
Exposure Range (2.10)

Normal and LSLR 9, 2 stops flare.jpg

A few quick things to point out. Two stops of flare for a 9 stop scene is higher than normally is found with that luminance range, but it is not unusual. The two stops of flare brings the effective luminance range of the 9 stop scene down to a 7 stop scene at the film plane.

As Normal processing is based on a 6 stop exposure range at the film plane, the film still requires reduced development, but not to the same degree. In this case minus one.

In the third example, the primary difference in the shadow gradient comes more from compressing the 9 stop range down to fit onto the paper compare to the degree of processing required to fit the normal 7 1/3 stop range onto the paper.
 

Bill Burk

Subscriber
Joined
Feb 9, 2010
Messages
9,290
Format
4x5 Format
Your third example, Comparing Statistical Normal Conditions with Film Processing Adjustment Example, looks like a very clear illustration of what N-2 and N would be. (Plus you've adjusted for flare which I like because it looks like a real world example.).
 
OP
OP
Stephen Benskin
Joined
Jan 7, 2005
Messages
2,612
Location
Los Angeles
Format
4x5 Format
So I assume the "non-flare" curve is not realistic?

It's more of a guide for comparison. Yes it would be near impossible to match the values, and you wouldn't want to even if you could. I'll do a post on that later. Maybe in a new thread.

I have been interested recently in the fourth quadrant curve of the "preferred" curve - that the 45-degree angle perfect curve is actually not attractive and there is a curve that is psychologically preferred. You may have shown that in recent posts? As I recall it is up and to the right of the 45-degree line but similar to your "normal" curve here. Is that right?

The curve in the normal 4 quadrant is what you want. Lighter than the original scene with a mid-tone gradient slightly higher than the original.
 
Last edited by a moderator:
OP
OP
Stephen Benskin
Joined
Jan 7, 2005
Messages
2,612
Location
Los Angeles
Format
4x5 Format
Your third example, Comparing Statistical Normal Conditions with Film Processing Adjustment Example, looks like a very clear illustration of what N-2 and N would be. (Plus you've adjusted for flare which I like because it looks like a real world example.).

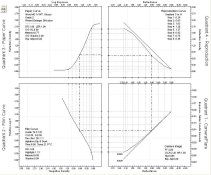
In case you want to see whole thing, here are the two 9 stop 4 quads and the normal one from the examples.

9 Stops 2 stops flare - processing change.jpg 9 Stops 2 stops flare - paper change.jpg Normal four quad.jpg
 
Last edited by a moderator:
OP
OP
Stephen Benskin
Joined
Jan 7, 2005
Messages
2,612
Location
Los Angeles
Format
4x5 Format
This is kind of interesting. In normal and nine stop comparison example, I aligned the curves at the highlight. Here is how they look without the adjustment.

Normal and LSLR 9, 2 stops flare - true orientation.jpg

Sorry, the example below has the same alignment as the first example of the normal to 9 stop comparison, but instead of readjusting the tone reproduction curves to align them with the highlight, I've adjusted the placement of the 9 stop luminance range so that both examples have the highlight to equal 100%. This way the metered exposure guide (dark dotted line) aligns correctly.

Normal and LSLR 9, 2 stops flare - R 100 orientation.jpg
 
Last edited by a moderator:
OP
OP
Stephen Benskin
Joined
Jan 7, 2005
Messages
2,612
Location
Los Angeles
Format
4x5 Format
Of all the potential factors that have an influence on the photographic process, the elimination of one would greatly simplify the process and make it fairly straight forward. All you would have to do is match up the negative density range to the paper log exposure range and the final print will match the original scene’s luminance range. That factor is us. How our eye and brain works adds an additional set of rules, variables, and exceptions on top of the simple curves we attempt to interpret. This area of study is subjective tone reproduction. I’ve included an excerpt from The Theory of the Photographic Process.

“The theory of subjective tone reproduction is concerned with the problem of reproducing the brightnesses of the original scene. [Brightness, in the terminology proposed by the Optical Society of America and adopted in this book, is the magnitude of the subjective sensation produced by light and luminance is the magnitude of the stimulus (light)] If the brightness of each point in the illuminated photograph is equal to the brightness of the corresponding point in the original scene, the photograph and its associated illuminance and surround are considered to be a combination that provides exact, subjective tone reproduction.

The achievement of exact reproduction of the scene luminances in an illuminated photograph does not necessarily mean that exact reproduction of the scene brightnesses will be obtained. If the angle subtended by the photograph is the same as that of the scene, and if the field of view surrounding such a photograph contains luminances that place the eye in the same state of adaptation and inhibition that it was in when the original scene was viewed, both exact luminance reproduction and exact brightness reproduction will be realized simultaneously. But the surround luminances that exist in viewing a photograph (as, for example, in viewing a slide transparency projected in a darkened room) are frequently very different than those that existed in viewing the original scene and, hence, the eye is seldom in the same state in the two situations. Very often, therefore, exact luminance reproduction would not produce exact brightness reproduction.

The illuminance on the photograph generally must be greater than that on the original scene if exact luminance reproduction is to be obtained. The reason for this requirement is that the semispecular reflections from shiny objects in the scene, such as hair, eyes, certain areas of the skin, jewelry, certain types of cloth, glassware, ceramics, fur, shiny leaves, rippling water, and many metallic objects, usually have a luminance greater than that of a diffuse white object in the scene. If the diffuse white object were to be recorded at the maximum reflectance of the photographic paper (approximately 90%), the shiny areas of the scene could not be reproduced at the required higher luminances. For true reproduction, therefore, the diffuse white objects in the scene must be recorded at a reflectance less than 90% so that the shiny areas in other objects can be recorded at 90% and thus have a luminance higher than that of the photographic record of the diffuse white objects. If, for example, the diffuse white objects in a living-room scene lighted with 100 foot-candles are reproduced so that they will have a reflectance of 45% in a photographic print and the brighter, semispecular objects are reproduced at a reflectance of 90%, the illuminance on the photograph must be 200, rather than 100, foot-candles. Similarly, the illuminance on a photograph of a sunlit scene must be considerably more than 10,000 foot-candles if exact luminance reproduction is to be achieved.

One of the important problems in photographic tone reproduction is that of reproducing the appearance of average outdoor scenes lighted with sunlight plus skylight. The illuminance on these scenes usually lies between 5000 and 10,000 foot-candles, depending on the angle between the sun and the principal plane of the main subjects in the scene. The photographs of these scenes, however, are usually viewed in homes, offices, classrooms, or art galleries where the illuminance is usually in the neighborhood of 50-100 foot-candles or less. The luminance of a white area in the photograph is then roughly one-hundredth the luminance of the corresponding white area in the sunlit scene; it is, in fact, roughly equal to the luminance of a nearly black object in the scene and yet it appears to be a satisfactory reproduction of a white object! It is only because of the remarkable ability of the eye to compensate for the low level of lighting, by increasing its sensitivity, that photographs can be viewed satisfactorily at the levels of illuminance commonly used in buildings. Exact luminance reproduction of sunlit scenes is not ordinarily attained in viewing photographs and, because of the properties of the eye, it is seldom required for satisfactory subjective tone reproduction.”


“The gradient in the middle tone region was always greater than 1.00 (usually 1.10 – 1.20) for the preferred point of all the scenes studied. Whenever the middle tone gradient was less than 1.10, the prints were unanimously rejected as being “too flat.” Whenever the density level of the prints was great enough so that the curves closely approached the 45-degree reference line, the prints were unanimously rejected because they appeared too dark.”
 
Last edited by a moderator:

Bill Burk

Subscriber
Joined
Feb 9, 2010
Messages
9,290
Format
4x5 Format
“The gradient in the middle tone region was always greater than 1.00 (usually 1.10 – 1.20) for the preferred point of all the scenes studied. Whenever the middle tone gradient was less than 1.10, the prints were unanimously rejected as being “too flat.” Whenever the density level of the prints was great enough so that the curves closely approached the 45-degree reference line, the prints were unanimously rejected because they appeared too dark.”

This should be relatively easy to represent in the fourth quadrant graph... And it would be interesting to see the film and paper curves that contribute to the preferred result.
 
OP
OP
Stephen Benskin
Joined
Jan 7, 2005
Messages
2,612
Location
Los Angeles
Format
4x5 Format
This should be relatively easy to represent in the fourth quadrant graph... And it would be interesting to see the film and paper curves that contribute to the preferred result.

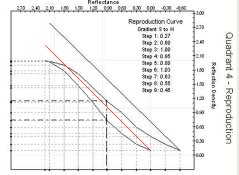
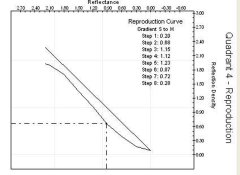
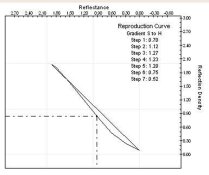
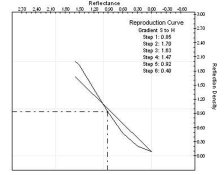
That's the reason why I decided to include the gradient table in the forth quad. Here are some examples going the other way: Normal, plus one, and plus two.

Normal.jpg Pkus one.jpg Plus 2  .jpg

And for those who like to over rate their film. This is a two stop underexposure, with development compensation.

Underexposure two stops.jpg

But it really isn't a two stop underexposure because the increase in development will shift the exposure some.

Underexposure 2 stops and speed adjustment.jpg

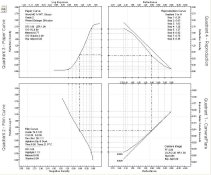
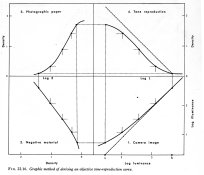
Here's the four quad from Theory of the Photographic Process.

Theory of photographic process - 4 quad.jpg
 
Last edited by a moderator:
Photrio.com contains affiliate links to products. We may receive a commission for purchases made through these links.
To read our full affiliate disclosure statement please click Here.

PHOTRIO PARTNERS EQUALLY FUNDING OUR COMMUNITY:


Ilford ADOX Freestyle Photographic Stearman Press Weldon Color Lab Blue Moon Camera & Machine
Top Bottom