Film Speed from development times

sdeeR

D
sdeeR

  • 0
  • 0
  • 19
Rouse St

A
Rouse St

  • 1
  • 0
  • 25
Untitled

A
Untitled

  • 2
  • 1
  • 41
Today's Specials.

A
Today's Specials.

  • 3
  • 0
  • 41
Street portrait

A
Street portrait

  • 1
  • 0
  • 35

Recent Classifieds

Forum statistics

Threads
199,172
Messages
2,787,444
Members
99,831
Latest member
wota69
Recent bookmarks
0
Joined
Jan 7, 2005
Messages
2,624
Location
Los Angeles
Format
4x5 Format
Stephen, thanks for your comments. I applied a bit of opaque tape to the step wedge, which left a spot on my negative that was not exposed. That patch on my negatives has measured 0.1 or 0.11 consistently. I erred in taking measurements from the rebate when the blank patch was available. Using the blank patch to compute FB+F+0.1 (= 0.2), rather than using the rebate for the FB+F+0.1 (=0.27) measurement, causes the anomalous 1/2 stop shift in the ISO triangle to disappear (Bill Burke's post #6). The plot below shows the relocated ISO triangle with base at 0.2 density units.

View attachment 310391

My apologies to the respondents to this post for dumb errors. I have learned more than a bit though, so thanks. Lesson not the least: the initial topic - could I use an systematic analysis of developed negatives to derive a more appropriate film speed for future shooting - may be more relevant once I have greater mastery of basic ideas and practice.

I'm not convinced whether attempting to determine film speed using anything other than a calibrated sensitometer is much better than an approximation which can be accomplished by doing a little shooting. However, the advantage you have with testing using curves is in determining a developmental model and in comparing emulsions. You keep referring to your triangle as an ISO triangle except you're appear to be using different dimensions. ISO is Δ1.30 log-H by Δ 0.80 log-H. Associating Zones and curves can also be problematic, especially for beginners. For one, the relationship between speed point and the metered exposure point is Δ1.0 log-H and not the Δ1.20 log-H of the Zone System. What does that say about the determination of film speed? Two, it also tends to suggest that the Zones are associated with specific densities.

I highly recommend the link to the papers in the Delta-X Criterion thread you started. A good overview of the papers are the chapters on sensitometry and tone reproduction in The Theory of the Photographic Process 3ed edition. If you've begun reading Photographic Materials and Process then you are off to a good start.

Concerning the Phil Davis influence I see in your tests. He mistakenly continued to apply a fixed density to determine speeds with films processed to higher or lower gradients that indicated in the ISO standard. According to one of the papers available in the link, Safety Factors in Camera Exposure, "The fractional-gradient speed criterion (and its approximate equivalent, the simpler ∆X speed criterion) will continue to be useful as a supplement to the fixed-density speed criterion when an evaluation is desired of the effective picture-taking speeds of films that have been developed to average gradients higher or lower than the proposed standard average gradient. The fixed density criterion tends to underrate films that are developed to a lower average gradient and to overrate films that are developed to a higher average gradient."
 

Bill Burk

Subscriber
Joined
Feb 9, 2010
Messages
9,326
Format
4x5 Format
It’s not so much mistakes as more a matter of seeing how different things influence results.

@Stephen Benskin his “flare” is not the same as contrast-reducing flare of a camera image that affects most people’s test results when they tape a step wedge to a window.

In this specific case I imagine flare as stray light from perimeter increasing the amount of light reaching the film plane - as it compares to the amount of light Tom thought he was putting there.

It would be worthwhile to compare this experiment to the way Adrian Bacon works. Adrian uses T-Stop calibrated equipment.

I also think Tom’s following my advice to move the -2.7 marking to the tip of the ASA triangle. So we still are “calibrating” and the x-axis labels are subject to change.
 
Joined
Jan 7, 2005
Messages
2,624
Location
Los Angeles
Format
4x5 Format
It’s not so much mistakes as more a matter of seeing how different things influence results.

@Stephen Benskin his “flare” is not the same as contrast-reducing flare of a camera image that affects most people’s test results when they tape a step wedge to a window.

In this specific case I imagine flare as stray light from perimeter increasing the amount of light reaching the film plane - as it compares to the amount of light Tom thought he was putting there.

It would be worthwhile to compare this experiment to the way Adrian Bacon works. Adrian uses T-Stop calibrated equipment.

I also think Tom’s following my advice to move the -2.7 marking to the tip of the ASA triangle. So we still are “calibrating” and the x-axis labels are subject to change.

Yes, but there isn't a range the "flare" light can interfere with. It is simply part of the exposure and won't add any addition exposure to the film plane especially as it is from a single toned subject filling or mostly filling the frame and it's not backlit. Tom is shooting with a camera and exposure meter. The most reasonable conclusion is user error or basically inconsistency in metering or with the settings on the camera.
 
OP
OP

tom williams

Subscriber
Joined
Jan 24, 2020
Messages
282
Location
Arizona
Format
4x5 Format
Yes, but there isn't a range the "flare" light can interfere with. It is simply part of the exposure and won't add any addition exposure to the film plane especially as it is from a single toned subject filling or mostly filling the frame and it's not backlit. Tom is shooting with a camera and exposure meter. The most reasonable conclusion is user error or basically inconsistency in metering or with the settings on the camera.

Stephen, I think I take your point about no camera flare: on- and off-axis light inside the camera lands on the step wedge, and counts as subject illumination.

But Bill's point seems germaine to me, in this way: the shutter speed and aperture for a test shot were determined using a spot meter, which does not necessarily share the same flux of scattered light that the camera does. Hence the spot meter could indicate a exposure different than would be assigned had the metering occurred at the film plane.

I think that by bringing the camera close to a white target in full (though oblique) sun, I could have maximized the scattered light in the camera. At the same time, I held the spot meter 5 feet away from the target, as the manufacturer recommends, mitigating (relatively) scattered light through its optics.

I have no idea about flare in the spot meter though, so I could be blowing smoke here.

And try as I might, user error is ever present. I'm working on that.
 
Joined
Jan 7, 2005
Messages
2,624
Location
Los Angeles
Format
4x5 Format
Stephen, I think I take your point about no camera flare: on- and off-axis light inside the camera lands on the step wedge, and counts as subject illumination.

But Bill's point seems germaine to me, in this way: the shutter speed and aperture for a test shot were determined using a spot meter, which does not necessarily share the same flux of scattered light that the camera does. Hence the spot meter could indicate a exposure different than would be assigned had the metering occurred at the film plane.

I think that by bringing the camera close to a white target in full (though oblique) sun, I could have maximized the scattered light in the camera. At the same time, I held the spot meter 5 feet away from the target, as the manufacturer recommends, mitigating (relatively) scattered light through its optics.

I have no idea about flare in the spot meter though, so I could be blowing smoke here.

And try as I might, user error is ever present. I'm working on that.

Bill's point is valid but it would only apply under conditions you probably wouldn't be testing under, like back lighting. Otherwise any "stray" light wouldn't be sufficient enough to add to the the exposure, especially if you are metering a white card, and certainly not 1/2 stop worth.

Determining a personal film speed is always problematic because of user error which includes testing under different conditions than the ISO standards or basically any conditions that cannot be precisely defined and controlled. One thing to consider with a spot meter is that any hand held meter doesn't see the actual exposure in the optical system. It has to assume general conditions. If those conditions are different, the exposure will be different than intended. This mostly makes little difference with general purpose use but can add to erroneous results with testing. If you can be consistent with a series of exposures for a family of curves, you will at least have relative speeds in comparison to degree of development. (if your use the correct system of measurement).
 

Bill Burk

Subscriber
Joined
Feb 9, 2010
Messages
9,326
Format
4x5 Format
For lack of better words it could be how well the “actinic” properties of the light fits the spectral sensitivity of the film, versus how badly the same light fits the meter’s receptor cell spectral response.

I recently calibrated an SEI photometer (which has a human eye sensor) to a reference light source. It corresponded well with a Sekonic L758-DR in daylight settings. But when I worked with a camera repairman’s light source (basically a Beseler enlarger light bulb with rheostats and resistor banks). I was surprised to find the SEI no longer matched the Sekonic.

Anyway tom’s estimated input doesn’t agree yet with the test results’ evidence of actual input. I think the best calibration (for home users) is to get the light as repeatable as possible, and let the film speed reveal itself as tom is doing
 

Bill Burk

Subscriber
Joined
Feb 9, 2010
Messages
9,326
Format
4x5 Format
Stephen and I have been talking about how it’s misleading to call this process “calibration”. So I will call my ideas (of adjusting x-axis to test results) something else, maybe “approximation.”

For lots of reasons the tip of the ASA triangle may not fall exactly under where the speed formula says it should.

If I had to guess, I would say it gets you within a sixth stop of accuracy after some iterations and as your own techniques in the lab improve with experience.
 
OP
OP

tom williams

Subscriber
Joined
Jan 24, 2020
Messages
282
Location
Arizona
Format
4x5 Format
.......

If I had to guess, I would say it gets you within a sixth stop of accuracy after some iterations and as your own techniques in the lab improve with experience.

The next step for me may be shooting a fresh test series, concentrating on reducing variability between shots, and on eliminating sloppy handling in preparation, shooting, developing, and in densitometry. I think a series would be good to show repeatability in the test procedure. Also, rather than trying to make identical exposures requiring independent development, I can eliminate potential variability in development if I can process all the shots simultaneously. So maybe 4 shots at speeds 64 through 125, all developed at 10m in xtol 1:1, 68F, as before. The 10 minute figure seems to work for me with negatives that are exposed properly.

In the meantime, I'm slogging my way through "Photgraphic Materials and Processes", and am preparing to practice the Delta-X method on the data I've already taken.
 
Joined
Jan 7, 2005
Messages
2,624
Location
Los Angeles
Format
4x5 Format
Greetings.

I wonder if anyone in the know could weigh in on a question about modifying film speed based on tested development times.

Background: A while back I determined an EI of 64 for FP4+ 4x5 film, developed in stock XTOL. A few days ago I exposed 5 sheets of film to a blank white target, in full sun, overlain by a 4x5 Stouffer step tablet, and developed them at times from 6 minutes to 18 minutes. The developer was XTOL diluted to 1:1, in contrast to the development of my speed test sheets with stock XTOL. I've attached a plot of density vs step (or Zone) for the development time test sheets.

I thought I would determine the optimum development time (for FP4+ EI 64 developed in XTOL diluted 1:1) by noting which curve intersected the vertical target bars at Zones V and VIII (the 4 small vertical bars. They cover Ansel Adams' suggested target densities for diffusion (orange bar) and condenser (black bar) enlargers). Obviously that didn't happen with the development times I selected, and I don't want to consider shorter development times than 6 minutes.

The data I used to determine speed indicate a linear progression in density vs exposure in the Zone V through Zone VIII interval, which is what makes me think that I can use these development test data to deduce a reasonably accurate film speed, without resorting to new speed and development time tests. It looks to me like an exposure decrease of 1 stop would bring the 10-minute development line into the range of AA's target densities. Is this a sensible idea?

Any thoughts or suggestions about this approach?

cheers
Tom

View attachment 306710

Hey Tom,

Since you are using your camera as a light source for exposing a step tablet, it's not too hard to determine the illuminance of the exposure. This will offer a little more control over the process; however, it's still technically relative exposure as the actual exposure can't be confirmed at the film plane. The critical take away from testing speed with a family of curves is not as much determining the exact speed but how speed varies with processing, and that works perfectly fine as relative exposure.

To start, a meter wants to make the metered exposure at the film plane 8 / ISO. For a 125 speed film, that will be 0.08 lxs. Black and white speed equation is 0.8 / Hm. For 125 speed film, Hm = 0.0064 lxs. It is 10x less exposure than at the metered exposure point or a difference of Δ1.0 log-H. I use a Kodak step tablet, and let's say I want 0.0064 to fall on the third step from the darkest step which is a density of 2.75.

To determine the exposure needed to an exposure of 0.0064 lxs, it's necessary to determine the Transmittance of the step.

1658363589654.png


Then determine the Illuminance.

1658363644972.png


Now all that is needed is to figure out how much additional exposure is needed to be added to the metered exposure.

1658363801973.png


About an additional 5 3/4 stops.

1658363908077.png


Here it is fleshed out for the entire step tablet. The metered exposure point of 0.064 lxs falls between the eleventh and twelfth step. If another step for the speed point is preferred, it's easy enough to pick which ever step you want to use for the aim speed point. Hopefully I didn't make an error in the calculations.

1658364071676.png
 
Last edited:
OP
OP

tom williams

Subscriber
Joined
Jan 24, 2020
Messages
282
Location
Arizona
Format
4x5 Format
Hey Tom,

Since you are using your camera as a light source for exposing a step tablet, it's not too hard to determine the illuminance of the exposure. This will offer a little more control over the process; however, it's still technically relative exposure as the actual exposure can't be confirmed at the film plane. The critical take away from testing speed with a family of curves is not as much determining the exact speed but how speed varies with processing, and that works perfectly fine as relative exposure.

To start, a meter wants to make the metered exposure at the film plane 8 / ISO. For a 125 speed film, that will be 0.08 lxs. Black and white speed equation is 0.8 / Hm. For 125 speed film, Hm = 0.0064 lxs. It is 10x less exposure than at the metered exposure point or a difference of Δ1.0 log-H. I use a Kodak step tablet, and let's say I want 0.0064 to fall on the third step from the darkest step which is a density of 2.75.

To determine the exposure needed to an exposure of 0.0064 lxs, it's necessary to determine the Transmittance of the step.

View attachment 310794

Then determine the Illuminance.

View attachment 310795

Now all that is needed is to figure out how much additional exposure is needed to be added to the metered exposure.

View attachment 310796

About an additional 5 3/4 stops.

View attachment 310797

Here it is fleshed out for the entire step tablet. The metered exposure point of 0.064 lxs falls between the eleventh and twelfth step. If another step for the speed point is preferred, it's easy enough to pick which ever step you want to use for the aim speed point. Hopefully I didn't make an error in the calculations.

View attachment 310798
Stephen, thank you for this. I'll apply this data in my next test cycle - which will be in about 2 weeks, if entropy permits. In the meantime I'll see what I can think up to improve my test operation.
cheers
Tom
 
Joined
Jan 7, 2005
Messages
2,624
Location
Los Angeles
Format
4x5 Format
To start, a meter wants to make the metered exposure at the film plane 8 / ISO. For a 125 speed film, that will be 0.08 lxs. Black and white speed equation is 0.8 / Hm. For 125 speed film, Hm = 0.0064 lxs. It is 10x less exposure than at the metered exposure point or a difference of Δ1.0 log-H. I use a Kodak step tablet, and let's say I want 0.0064 to fall on the third step from the darkest step which is a density of 2.75.

Correction: 8/125 = 0.064

Also, for your method of opening up 5 stops.
1658544758828.png

The illuminance is 2.024 lxs and the step density where 0.0064 will fall is 2.50.

What if 0.10 over Fb+f falls at another point on the step tablet, like 2.45?
1658545333593.png

For an exposure of 2.024 lxs
1658545527123.png
 

Bill Burk

Subscriber
Joined
Feb 9, 2010
Messages
9,326
Format
4x5 Format
I like to have the speed point fall between step 18 and 19, that way you expect to have to interpolate the graph position of the speed point (less chance of “confirmation bias” than if you aim for a step to be 0.1 above filmbase plus fog). Also it is useful to have one lower density result to see what the toe shape is like.
 
OP
OP

tom williams

Subscriber
Joined
Jan 24, 2020
Messages
282
Location
Arizona
Format
4x5 Format
Bill, a question about your plot on your post #3: I see that the zero point of the upper scale (the film speed scale) is offset from the zero point of the lower scale (the Log H axis) by about 0.3 units. That's not including the offset created by your cut-and-tape adjustment. Otherwise, I believe both axes are graduated in 0.02 log exposure units per division. Could you mention the nature of the offset between the two axes?
 

Bill Burk

Subscriber
Joined
Feb 9, 2010
Messages
9,326
Format
4x5 Format
You are correct the ruled lines are 0.02 log units. This allows graphing to 0.01 precision because the in-between marks are legible. The bottom axis is the density of the step wedge over the film. I have calibration lines for the actual densities of the step wedge, so thats why you see some in-between vertical lines. Zero on the lower scale means no density over the film.

The top scale slides back and forth to match my opinion of what the actual sensitometer exposure at the film plane might have been. Zero on the upper scale is one meter candle second.
 
OP
OP

tom williams

Subscriber
Joined
Jan 24, 2020
Messages
282
Location
Arizona
Format
4x5 Format
Greetings.

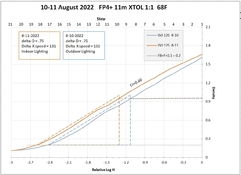
A couple of film speed tests are documented in the attached graph. I attempted to clean up my test procedure, following comments by Bill and Stephen in posts preceding this one. Errors are obviously mine. One thing that became obvious is that my control over most of the test process was modest, and in several ways it isn’t likely to improve substantially with my current hardware. The wetware contribution … hmmm….

I did test and put into service the most precise shutter and shutter speed at hand. Every exposure was taken at 1/8s in a copal 1 shutter, which in current and previous tests had less than 1% variability over 5 consecutive shots. I've never had reason to doubt the apertures in that shutter, but the accuracy and repeatability of the apertures are unknown. I did have to use apertures at and close to the f8 extreme.

Uniform target illumination? Indoors, I cobbled together 7 disparate 'daylight' lamps and droplights and arranged them so that the target (white matt board) was uniformly illuminated. After the test shots, about 10% of the photographed target was 0.2EV brighter than the rest of the target.

Outdoors, it was a sunny morning with very light cirrus. I made sure that I exposed within 10 seconds of metering to obviate source variability. I metered the target (the same target used indoors) before and after the series of test exposures and measured no variations in target uniformity.

I only now have realized the role ND filters could play in my outdoor shooting and in this test. I could have brought the outdoor illumination down to place the speed point about where I wanted, but instead just accepted what the good lord Sun gave me. Indoors, the target illumination was coincidentally about right to place the speed point close to step 18. A lesson learned there.

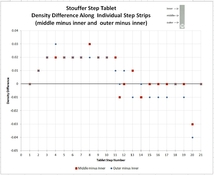
All the negatives got exactly the same treatment in an SP-445, including a fresh batch of xtol 1:1 for each of the two developing runs. After taking densitometer readings of the test negatives, I saw some mottling on the Stouffer TP 4x5 tablet and wondered about its effect. I took densitometer readings of the step tablet density strips, at the extremities and at the middle of each step strip. A plot of those results is attached. Each datum is the quantity “density reading at the middle(outer) part of the step strip minus the density reading at the inner edge of the step strip”. The strip inner, middle and outer locations are indicated in an image to the upper right of the plot. I haven’t evaluated the effect on the film curves yet. Time for a new tablet I guess – though I haven’t tested a fresh tablet in this way, to know what intra-strip variability is inherent in the product.

In the H&D graph, the large triangles are ISO triangles 1.3 in log H along the horizontal base, 0.8 in density units along the perpendicular leg. The horizontal lines intersecting the triangles and the right hand density axis are used to indicate the delta-D value for the Delta-X speed computation. Hope I got that right.

Cheers

Tom

HandD_8-10-2022.jpg Stouffer_Strips.jpg
 

Adrian Bacon

Subscriber
Joined
Oct 18, 2016
Messages
2,086
Location
Petaluma, CA.
Format
Multi Format
It’s not so much mistakes as more a matter of seeing how different things influence results.

@Stephen Benskin his “flare” is not the same as contrast-reducing flare of a camera image that affects most people’s test results when they tape a step wedge to a window.

In this specific case I imagine flare as stray light from perimeter increasing the amount of light reaching the film plane - as it compares to the amount of light Tom thought he was putting there.

It would be worthwhile to compare this experiment to the way Adrian Bacon works. Adrian uses T-Stop calibrated equipment.

I also think Tom’s following my advice to move the -2.7 marking to the tip of the ASA triangle. So we still are “calibrating” and the x-axis labels are subject to change.

I use T-Stop calibrated equipment, AND I fill the frame so there is no flare to speak of.
 

Bill Burk

Subscriber
Joined
Feb 9, 2010
Messages
9,326
Format
4x5 Format
I agree you both eliminate the effect of flare.

Interesting that indoors curve is “to the left” of outdoors in Tom’s tests.

A slightly longer development time may have hit the ASA triangle better.

I forgot to bring the papers and numbers on my road trip, as always feel free to send me numbers to check.

When I find variations in step wedge readings, I average them unless I have reason to believe some readings should be thrown out (like they are at the edge and developed more due to better agitation).
 
OP
OP

tom williams

Subscriber
Joined
Jan 24, 2020
Messages
282
Location
Arizona
Format
4x5 Format
I forgot to bring the papers and numbers on my road trip, as always feel free to send me numbers to check.

When I find variations in step wedge readings, I average them unless I have reason to believe some readings should be thrown out (like they are at the edge and developed more due to better agitation).
Bill, the plot I gave of the step tablet density differences is of the Stouffer Tablet itself, and not of the negatives I made with the tablet+negative 'sandwich'. The Stouffer Tablet strip density variations worried me, as I figured they would transfer their density inhomogeneity to the negatives.

I don't understand why the two curves are not on top of one another, given that the negatives were both exposed 5 stops over the metered value on the same target. It did cross my mind that there could be a convolution of different light source spectra, meter spectral sensitivity, film spectral sensitivity, and target reflectivity at work. But that's above my pay grade to evaluate.

My numbers for the speed trials below. I tried to attach an Excel file, without success. I did attach a tab separated text file.

cheers
Tom


Relativ, ,8-10-22, 8-11-22
Log H, Step, ISO 125, ISO 125
0, 1, 1.61, 1.66
-0.15, 2, 1.52, 1.59
-0.3 , 3, 1.44, 1.52
-0.45, 4, 1.35, 1.45
-0.6, 5, 1.27, 1.37
-0.75, 6, 1.17, 1.28
-0.9, 7, 1.09, 1.2
-1.05, 8, 0.99, 1.11
-1.2, 9, 0.9, 1.02
-1.35, 10, 0.81, 0.92
-1.5, 11, 0.74, 0.83
-1.65, 12, 0.64, 0.76
-1.8, 13, 0.53, 0.66
-1.95, 14, 0.43, 0.56
-2.1, 15, 0.35, 0.46
-2.25, 16, 0.27, 0.37
-2.4, 17, 0.21, 0.29
-2.55, 18, 0.17, 0.22
-2.7, 19, 0.14, 0.17
-2.85, 20, 0.12, 0.13
-3, 21, 0.11, 0.11

Taped patch, , 0.1 , 0.1, (=FB+F)
 

Attachments

  • 8-11-2022_densitometry.txt
    545 bytes · Views: 67

Bill Burk

Subscriber
Joined
Feb 9, 2010
Messages
9,326
Format
4x5 Format
Thanks Tom,


a convolution of different light source spectra, meter spectral sensitivity, film spectral sensitivity, and target reflectivity at work.

Probably, and it could be figured out with a little experimenting with filters. Do you have any Tungsten to Daylight balancing filters (e.g., 80B)? See how much difference the filter makes to your meter reading versus the published filter factor for it.
 
OP
OP

tom williams

Subscriber
Joined
Jan 24, 2020
Messages
282
Location
Arizona
Format
4x5 Format
Thanks Tom,


a convolution of different light source spectra, meter spectral sensitivity, film spectral sensitivity, and target reflectivity at work.

Probably, and it could be figured out with a little experimenting with filters. Do you have any Tungsten to Daylight balancing filters (e.g., 80B)? See how much difference the filter makes to your meter reading versus the published filter factor for it.
I have an 80A and an 85B - the 80A seems close enough. I'll set the indoor lighting scheme up again and check it out in the next couple of days.
 
OP
OP

tom williams

Subscriber
Joined
Jan 24, 2020
Messages
282
Location
Arizona
Format
4x5 Format
Thanks Tom,


a convolution of different light source spectra, meter spectral sensitivity, film spectral sensitivity, and target reflectivity at work.

Probably, and it could be figured out with a little experimenting with filters. Do you have any Tungsten to Daylight balancing filters (e.g., 80B)? See how much difference the filter makes to your meter reading versus the published filter factor for it.

Bill, I have a junk-quality 80A filter (Rolev MG 80A), and I find no useful online data for it. I see that Tiffen and Hoya advertise 2 and 1.3 stop corrections for their 80A filters.

I compared spot meter readings of a re-creation of my indoor lighting setup from August 11, with and without the filter held in front of the spotmeter aperture. I measured 14.9 EV without the filter (consistent with the 8-10 setup), and 13.6 EV with the filter. Both at ISO 125, as before. The 1.3 EV difference is consistent with the filter factor Tiffen advertises.

I also made three measurements of the target, one measurement for each of the three types of bulb I used in the 8-11 test. I subtracted spotmeter readings made with filtration from readings taken without filtration, for each bulb, and found differences of 0.9, 1.0, and 1.3 EV. I'm guessing that the smaller the difference, the less the bulb+target looks like a 3200K source and the more it looks like something bluer. If that's right, my bulbs weren't very 'daylight' after all.

I don't have and didn't find online information on the Sekonic L-778 spotmeter spectral response.

That's all for just now.
Cheers
Tom
 
Photrio.com contains affiliate links to products. We may receive a commission for purchases made through these links.
To read our full affiliate disclosure statement please click Here.

PHOTRIO PARTNERS EQUALLY FUNDING OUR COMMUNITY:


Ilford ADOX Freestyle Photographic Stearman Press Weldon Color Lab Blue Moon Camera & Machine
Top Bottom