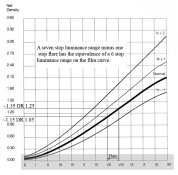
The first problem with all this methodology is that it tries to boil tone reproduction down to one number - ISO contrast/LER/CI/...
Well, that's kind of an overstatement and oversimplification. The numbers aren't intended to be all encompassing explanations and it would be disingenuous to suggest otherwise. But they do carry with them information beyond just the numbers. There's the testing conditions under which they were determined as well as the supporting theory behind the methodology. Something like ISO speed carries with it the entire testing parameters defined in the standard, which are supported by numerous papers and studies. Even with all of what's behind the numbers, they just represent one or two tools in the toolbox.
Is anyone claiming the methods are perfect? Of course not. The short comings as well as the strengths and reasons for one method over another are covered in various papers. In "The Control of Photographic Printing by Measured Characteristics of the Negative" by Loyd Jones for example, Jones found there wasn't a single criteria that gives a high correlation in all cases between the optimum quality obtainable in a print and negative parameters. In an uncharacteristic manor he laments that "it might be felt at this point that the situation is hopeless and that the negative density range criterion for choosing the paper contrast grade should be abandoned. However, no other unique and measurable negative characteristic has been discovered which is useful as a substitute criteria." He goes on to say that it's not really as bad as it first sounds.
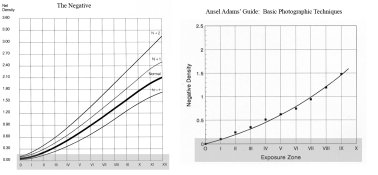
The shape of HD curves vary all over the place. To try and characterize a given curve with one number may have been state-of-the-art in 1929 but doesn't, to my mind, cut it anymore.
More of the perfect being the enemy of the good argument. If not, then what?
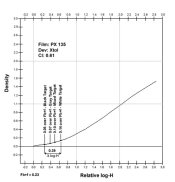
The HD curve is a continuum of points. It can not be mathematically defined, nor should it be. It is best to work with the raw curve as it lays.
The curve itself is a mathematical construct. Ultimately there will always be a gap between the science and the art, but there's psychophysics in subjective tone reproduction which helps define how people will generally respond to given conditions.
The second problem is the insistence on using the full range of tones on either the negative or paper. The pictures I have that use the full tonal and informational range look just like drugstore prints, high quality drugstore prints I like to think, but boring dull snapshots all the same unless you are interested in Great Aunt Edna or what Timmy looked like at age 5.
The insistence is strictly from pop culture and not from photographic theory. There's a very interesting explanation in Theory of the Photographic Process 3rd edition on and around page 489. It basically supports your point, but without the strawman.
There's a lot of information that can be gained from what ic-racer calls "system testing" (nice term BTW), especially when it's about the interaction between the various elements (original subject, camera image, negative, print, reproduction). Will it tell me if my photograph will likely hang in a gallery? No, but it will help to better explain how the photographic process works if that's what you're interested in, but it's just one aspect of photography. It's not a panacea.
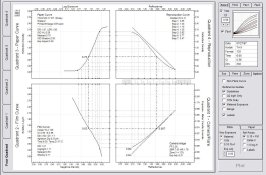
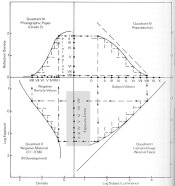
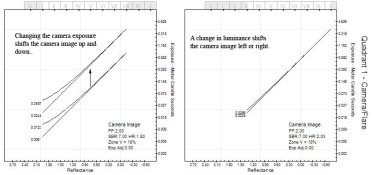
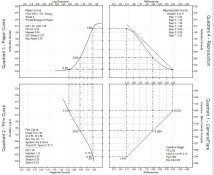
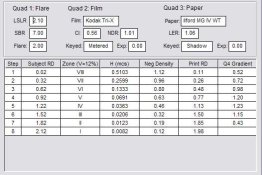
Using the four quadrant reproduction curve, I'm able to explore many different scenarios and test different points of theory such as 18% or 12%, speed point and flare, and Delta-X speed. No more "light meters read 18%" crap for me. Curves are basically meaningless if you don't interpret them.
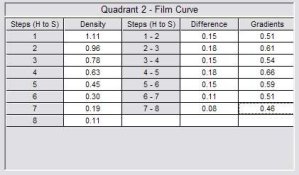
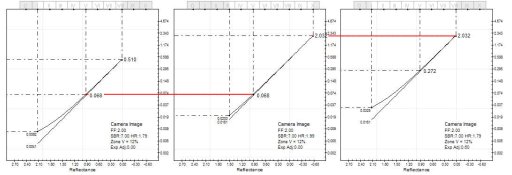
I'm also working on different ways to compare and evaluate the data. The different attachments show the different gradients for each of the steps in the guidelines, a more detailed breakdown for the film quadrant, and a breakdown of the values in the camera image quadrant. Bit by bit it all adds up to a better understanding of the photographic process which might just make it slightly easier to obtain the creative results one desires.


 .
. 