(Generic, not directed at CPorter) It seems intuitive to me, but I did not see it mentioned, but when doing an exposure index test by photographing a reflection step wedge, you are basing the exposure index on 0.1 above film base plus fog plus flare right? You should have a black patch in the scene, you have been measuring that to get the baseline density along with the film base and fog right? If you subtract the density of your black patch from film base + fog that is an indicator of how much flare there is.
-
Welcome to Photrio!Registration is fast and free. Join today to unlock search, see fewer ads, and access all forum features.Click here to sign up
You are using an out of date browser. It may not display this or other websites correctly.
You should upgrade or use an alternative browser.
You should upgrade or use an alternative browser.
Critical Thinking 2 - Normal Negative Density Range - ZS vs Tone Reproduction
-
A
- Thread starter Stephen Benskin
- Start date


Recent Classifieds
-
Want to Buy Arca swiss plate for Mamiya RZ67
- Started by blee1996
-
For Sale Hi-Con IR film
- Started by MCB18
-
Want to Buy Hasselblad tripod quick release plate... level
- Started by eli griggs
-
For Sale Fotodiox Pronto AF adapter
- Started by OAPOli
-
Sold 612 Holga modded body
- Started by OAPOli
Forum statistics
OP
OP
(Generic, not directed at CPorter) It seems intuitive to me, but I did not see it mentioned, but when doing an exposure index test by photographing a reflection step wedge, you are basing the exposure index on 0.1 above film base plus fog plus flare right? You should have a black patch in the scene, you have been measuring that to get the baseline density along with the film base and fog right? If you subtract the density of your black patch from film base + fog that is an indicator of how much flare there is.
Not quite. There's the obvious question of whether the degree of flare introduced in the testing method represents the level encounter in shooting conditions. There's also a question of how reflective the black patch is. Davis' black box could solve that problem. Another concern is the luminance range of most reflection step tablets is shorter than the average scene's luminance range. I think mine was 1.80 or 1.90 as opposed to 2.20 for the scene.
Mostly it's a question of knowing where the exposure should fall in order to correctly evaluate the influence of flare. Otherwise you can't distinguish flare from camera exposure. Let's take an extreme example, You've over exposed the test accidentally without being aware of it. How can you be certain the bottom black step's placement isn't just from flare? My black box flare test included a sensitometric exposure as a reference.
Mostly it's a question of knowing where the exposure should fall in order to correctly evaluate the influence of flare. ....
My thought, again, is that flare is independent of the image and it has no influence on the optimum exposure.
We had a good discussion about various methods of speed determination, and in a similar manner to the way in which development (which alters contrast) does not change the minimum gradient upon which speed is based, likewise, flare does not change the minimum gradient either (it just changes contrast).
For example, you are set up to take a picture and have determined the exposure based on any method that has been already determined to give shadow detail to your liking under those conditions. Now as you make the exposure I shine a bright light at your lens, increasing your flare. I did not cause you to overexpose, and I did not cause you to underexpose. In fact no amount of exposure change in either direction can alter the effects of the flare.
To further clarify the point, I predict that if we took a panel of observers and had them rank photographs from negatives of the same scene with various exposures, and then repeated the test with a lens of increased flare (same scene, same exposure sequence), the panel grading of prints would lead to the same minimum exposure for acceptable print for both sets of prints (high flare and minimal flare).
What do you think?
OP
OP
Thanks Chuck, this fits in perfectly with the critical thinking concept of the thread. And please understand that while I'm using your post to help illustrate my point, the choice is mostly happenstance. We are all guilty of doing the following.
Definition:
Logical Fallacy: In logic and rhetoric, a fallacy is incorrect reasoning in argumentation resulting in a misconception.
In the type of testing you are showing in your examples, it is. Its only the testing procedures that are flare free, not the interpretation of the data. You contacted the step tablet; therefore, there is no flare. The film curve plotted shows how the film responds to exposure and development. It is without flare. The reason speed point falls only 3 1/3 stops below the metered exposure (fact) when the shadows falls 4 1/3 stops below (fact) is because flare brings the exposure back up to the speed point (fact). So, what you are doing is incorporating flare into the speed analysis of a non flare test.
Traditional Zone System is different. While it uses an optical system, the resulting flare is minimal. It has the speed point 4 stops down from the metered which is a 2/3 stop difference between the two methods. You have misstated the argument (Logical Fallacy).
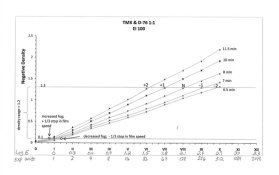
You are also begging the question in which the proposition to be proven is assumed implicitly or explicitly in the premise. I guess you could also consider it circular reasoning. You can see the curve reaches a 0.1 negative density at Zone I. Isnt the definition of Zone I the point on the curve where the density is 0.10? The fact that the curve encounters Zone I at some point only proves that the film encounters Zone I at some point. You are saying its correct because you got an answer without proving proof. What is required is the exposure value at that point.
More circular reasoning, which can be eliminated by explaining how you know you are getting full box speed from the test. The question with Schaefers method is whether the exposure you think you are getting is what you are in fact getting. Film speed is based on how much light is required to create a certain density. Youre missing that very component in the equation. But as this is a separate issue from the topic about the relationship of flare and the determination of speed between to testing methods, it is simply mudding the waters (another logical fallacy).
If your testing methods are consistent, you can accurately compare the results of one test against another using only relative film speeds, but the actual value of the film speed remains unknown. This is what youve done with the two examples youve presented. If the exposure part of the testing method has remained consistent, any difference in the results have to be attributed to the component of the method that has been changed. In our case, the developer. Therefore, your examples are a fine demonstration of the affects of two different developers on film speed. However, this is an argument from a false premise or specious reason. You are presenting an argument that mistakenly attempts to establish a causal relationship where one doesn't exist. Your results can be attributed to changes in development and not exposure because in your test the exposure was the same and the development was the variant. However, you are falsely presenting the premise that these same results can address the question of the accuracy of two different exposure methods. You cant prove or disprove something if you havent first established a causal relationship. (Ad hoc fallacy? also known as the false cause fallacy). I could also add data mining in that youve selectively chosen an example in an attempt to prove your point simply because there is a 2/3 stop difference in their film speeds.
Argument from authority. Just because someone in authority says something doesnt mean its correct. An argument requires proof. I have shown how flare works in camera and how in testing procedures it is at a minimum. And contacting eliminates any flare from testing, so it has to be incorporated into the analysis. Flare isnt a factor in your testing system, but it is a factor when shooting.
That should be the norm in any testing method. Does the testing reflect the results obtained by use and are the tests accurate? The ISO film speed standard brought some some major changes to it in 1993. The ISO developer changed as did the method of development and the hold time because they felt the changes would result in testing that more accurately represents reality (also know as the type of results you get in use).
Chuck, you tend to interpret my analysis of some point of theory from the standpoint of a false dichotomy which only presents two choices. It is either all one way or the other. Well, it can be many different ways. A system can work and still have inaccuracies, and just because it works doesnt mean it is entirely correct. Your contention as to whether reality is simply not that great of a difference is an argument from incredulity. Facts dont depend on whether someone can accept them or not (ie I dont believe in Evolution. Or I believe the Earth is 6000 years old or I cant accept that .).
Other than the Pragmatic argument this is most often use by you. You haven't addressed directly any of the examples and models I've presented (including a curve from Adams' own book). How was the reasoning wrong on that one? It's only wrong because you can't accept it. We're living in a country accepting where incredulity is increasingly trumping scientific consensus. Can we please stop it's spread here?
You can get results from your testing that work for you (pragmatic fallacy), but that doesnt address the question whether a point of theory is correct or not. And simply because you see an absence of something doesnt mean it is absent (another logical fallacy). With point of theory here, there is, you just dont know its there. Your making the assumption that the interpretation of the data from your non-flare testing method applies directly to usage without ever confirming the results or fully thinking things through. Your testing method excludes flare, flare exists in shooting conditions. These facts need to be reconciled not denied.
Logical fallacies are the enemy of critical thinking. If critical thinking came easily for us, we wouldn't have had religion for 100.000 years before we had science.
I began this thread to propose a thought. Are we properly questioning the various aspects on how the photographic process works? To help illustrate that question I use a few points of theory as examples.
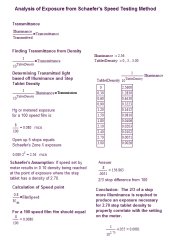
If attached the proof of my concerns about the accuracy of Schaefers film speed testing method.
Definition:
Logical Fallacy: In logic and rhetoric, a fallacy is incorrect reasoning in argumentation resulting in a misconception.
You can see the curve reaches a 0.1 negative density at Zone I, not at Zone I 2/3 or Zone II. Flare? Perhaps it is incorporated into the speed point, IDK, but I know what you think.
In the type of testing you are showing in your examples, it is. Its only the testing procedures that are flare free, not the interpretation of the data. You contacted the step tablet; therefore, there is no flare. The film curve plotted shows how the film responds to exposure and development. It is without flare. The reason speed point falls only 3 1/3 stops below the metered exposure (fact) when the shadows falls 4 1/3 stops below (fact) is because flare brings the exposure back up to the speed point (fact). So, what you are doing is incorporating flare into the speed analysis of a non flare test.
Traditional Zone System is different. While it uses an optical system, the resulting flare is minimal. It has the speed point 4 stops down from the metered which is a 2/3 stop difference between the two methods. You have misstated the argument (Logical Fallacy).
You are also begging the question in which the proposition to be proven is assumed implicitly or explicitly in the premise. I guess you could also consider it circular reasoning. You can see the curve reaches a 0.1 negative density at Zone I. Isnt the definition of Zone I the point on the curve where the density is 0.10? The fact that the curve encounters Zone I at some point only proves that the film encounters Zone I at some point. You are saying its correct because you got an answer without proving proof. What is required is the exposure value at that point.
Since it is a speed test, Kodak's ISO speed of 100 was used. I'm getting full box speed with TMX and D-76 1:1.
More circular reasoning, which can be eliminated by explaining how you know you are getting full box speed from the test. The question with Schaefers method is whether the exposure you think you are getting is what you are in fact getting. Film speed is based on how much light is required to create a certain density. Youre missing that very component in the equation. But as this is a separate issue from the topic about the relationship of flare and the determination of speed between to testing methods, it is simply mudding the waters (another logical fallacy).
If your testing methods are consistent, you can accurately compare the results of one test against another using only relative film speeds, but the actual value of the film speed remains unknown. This is what youve done with the two examples youve presented. If the exposure part of the testing method has remained consistent, any difference in the results have to be attributed to the component of the method that has been changed. In our case, the developer. Therefore, your examples are a fine demonstration of the affects of two different developers on film speed. However, this is an argument from a false premise or specious reason. You are presenting an argument that mistakenly attempts to establish a causal relationship where one doesn't exist. Your results can be attributed to changes in development and not exposure because in your test the exposure was the same and the development was the variant. However, you are falsely presenting the premise that these same results can address the question of the accuracy of two different exposure methods. You cant prove or disprove something if you havent first established a causal relationship. (Ad hoc fallacy? also known as the false cause fallacy). I could also add data mining in that youve selectively chosen an example in an attempt to prove your point simply because there is a 2/3 stop difference in their film speeds.
AA contends that flare is accounted for, IDK, really. Am I drinking the cool-aid, I'm sure many will say yes. Perhaps the flare is just not as much of factor in my system as some may think it should be, IDK.
Argument from authority. Just because someone in authority says something doesnt mean its correct. An argument requires proof. I have shown how flare works in camera and how in testing procedures it is at a minimum. And contacting eliminates any flare from testing, so it has to be incorporated into the analysis. Flare isnt a factor in your testing system, but it is a factor when shooting.
This is the method taught by Schaefer and one that is under the gun here in that it is not believed that it represents "reality". I contend that the "reality" is simply not that great of a difference.
That should be the norm in any testing method. Does the testing reflect the results obtained by use and are the tests accurate? The ISO film speed standard brought some some major changes to it in 1993. The ISO developer changed as did the method of development and the hold time because they felt the changes would result in testing that more accurately represents reality (also know as the type of results you get in use).
Chuck, you tend to interpret my analysis of some point of theory from the standpoint of a false dichotomy which only presents two choices. It is either all one way or the other. Well, it can be many different ways. A system can work and still have inaccuracies, and just because it works doesnt mean it is entirely correct. Your contention as to whether reality is simply not that great of a difference is an argument from incredulity. Facts dont depend on whether someone can accept them or not (ie I dont believe in Evolution. Or I believe the Earth is 6000 years old or I cant accept that .).
Other than the Pragmatic argument this is most often use by you. You haven't addressed directly any of the examples and models I've presented (including a curve from Adams' own book). How was the reasoning wrong on that one? It's only wrong because you can't accept it. We're living in a country accepting where incredulity is increasingly trumping scientific consensus. Can we please stop it's spread here?
You can get results from your testing that work for you (pragmatic fallacy), but that doesnt address the question whether a point of theory is correct or not. And simply because you see an absence of something doesnt mean it is absent (another logical fallacy). With point of theory here, there is, you just dont know its there. Your making the assumption that the interpretation of the data from your non-flare testing method applies directly to usage without ever confirming the results or fully thinking things through. Your testing method excludes flare, flare exists in shooting conditions. These facts need to be reconciled not denied.
Logical fallacies are the enemy of critical thinking. If critical thinking came easily for us, we wouldn't have had religion for 100.000 years before we had science.
I began this thread to propose a thought. Are we properly questioning the various aspects on how the photographic process works? To help illustrate that question I use a few points of theory as examples.
If attached the proof of my concerns about the accuracy of Schaefers film speed testing method.
Attachments
Last edited by a moderator:
- Joined
- Feb 9, 2010
- Messages
- 9,544
- Format
- 4x5 Format
I'd wish to know how much flare there was in the front-end of my system (Camera Flare), to know that what I might otherwise put in the N batch by meter readings could better be served by an N+1 development because the flare reduced the contrast.
I'd also like to know how much flare there is on the back-end of my system (Enlarger Flare), so that I could pick an appropriate density target for development.
I'd also like to know how much flare there is on the back-end of my system (Enlarger Flare), so that I could pick an appropriate density target for development.
OP
OP
Chuck,
Two quick points.
One:
As you can see from using your own test data, the difference is in interpretation of the data. Data is meaningless unless it is correctly interpreted and curves are data.
Two:
This is more of a thought experiment. The Zone System has been around since the 40s without a major change in it's testing methodology. Before 1960s the ASA/ANSI film speed standard produced speeds that would be considered one stop slower that what would result from testing with today's standard. The reason why speeds were slower is because the standard had a higher safety factor (which basically accounted for two stops of flare). Prior to 1960s traditional Zone System testing would have produced results in agreement with the standard.
ANSI reduced the safety factor in 1960 and the Zone System continued unchanged. Now the difference in speeds obtained between the two methods generally ranges from 1/2 to 1 stop.
What is your take on what this means and its implications?
Attachments
Last edited by a moderator:
OP
OP
I'd wish to know how much flare there was in the front-end of my system (Camera Flare), to know that what I might otherwise put in the N batch by meter readings could better be served by an N+1 development because the flare reduced the contrast.
Flare is what makes obtaining precise negative impossible and good negatives without thinking possible. You just need to work with the averages and be aware what the limitations are.
If you think about it, you're actually developing to a minus one for average conditions. Average luminance range - flare. The average flare is 1 1/3 stops. The average scene is 2.20. At the film plan that makes an illuminance range of 6 stops.
I have something that I've written on determining a film developmental model which incorporates flare. I'd be happy to send you a copy.
Last edited by a moderator:
-

- Chuck_P
- Deleted
What is your take on what this means and its implications?
By your manipulation of the graph, the flare reduced the contrast by reducing the density range and creating a softer negative, but I've understood this from the beginning. To reach a Zone VIII target of 1.15 neg density would require a shallower curve---that's probably not what you are looking for, IDK. My biggest contention in my mind (however wrong I am) is the degree to which flare affects the outcome. But I don't pretend to follow why you drew it in between 1.6 and 1.9 on the log Exp scale.
Last edited by a moderator:
OP
OP
My thought, again, is that flare is independent of the image and it has no influence on the optimum exposure.
We had a good discussion about various methods of speed determination, and in a similar manner to the way in which development (which alters contrast) does not change the minimum gradient upon which speed is based, likewise, flare does not change the minimum gradient either (it just changes contrast).
For example, you are set up to take a picture and have determined the exposure based on any method that has been already determined to give shadow detail to your liking under those conditions. Now as you make the exposure I shine a bright light at your lens, increasing your flare. I did not cause you to overexpose, and I did not cause you to underexpose. In fact no amount of exposure change in either direction can alter the effects of the flare.
What do you think?
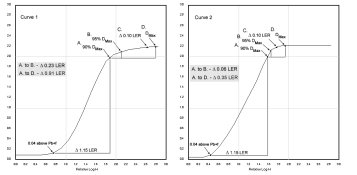
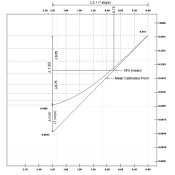
I'm not sure I can agree, although I may not understand what your point is. The only way I can see flare as independent of the image is in the context of the subject matter. Film speeds would be one stop slower without flare. And as you can see from the standard model example attached, there is compression of the shadow's illuminance range. The second example has a flare factor of 1.5 stops. The midtone placement barely changes but you can see how the much more the shadow image is compressed and place further up on the curve.
A point of interest(?). The dot below the film speed point of 0.10 is the fractional gradient speed point (actually Delta-X speed). Even in a unrealistic impossible zero flare scene, the minimal shadow will still be reproducible. It can also be thought of as an under exposure safety factor.
Does this in anyway come close to responding to the point you are making in your post?
Attachments
OP
OP
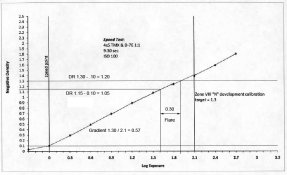
By your manipulation of the graph, the flare reduced the contrast by reducing the density range and creating a softer negative, but I've understood this from the beginning. To reach a Zone VIII target of 1.15 neg density would require a shallower curve---that's probably not what you are looking for, IDK. But I don't pretend to follow why you drew it in between 1.6 and 1.9 on the log Exp scale.
This is around the fourth time I've written this post. While reviewing your graph I noticed something. I'm hoping that I am just not understanding your intentions. I sincerely wish to resolve this point of confusion.
The reason why I drew the line at 1.9 log-H range is because that's where the curve crossed the line you drew at a highlight density of 1.30. On the graph, you have written "DR = 1.20" which I assumed was the density range you determined for the curve. You have also written "development calibration target = 1.30" which supports the DR 1.20 concept.
However, you also have a reference line at a log-H range of 2.10 that intersects the curve at a density of 1.40 making for a density range of 1.30. I'm assuming your aim luminance range is 2.10. That means for this test, with your testing parameters, the resulting negative density range is 1.30. As you can see, this appears to be conflicting information.
The only way 1.30 doesn't come into conflict with the written "DR=1.20" is to assume the "DR = 1.20" is just a label and not the results you've determined from the test. That the curve, in fact, is slightly contrasty and needs to come down some to match the 2.10 log-H range to the aim negative density range of 1.20.
I hope I'm interpreting this correctly because I want to give you the benefit of the doubt. If I am interpreting this correctly, then the basic concept of what I did with your curve still works. Just shift it over to log-H range for a DR of 1.30 and the other line to 1.80 for a density range of 1.15. An LER of 1.15 is what I got for Oriental Seagull grade 2 with my diffusion enlarger.
My biggest contention in my mind (however wrong I am) is the degree to which flare affects the outcome.
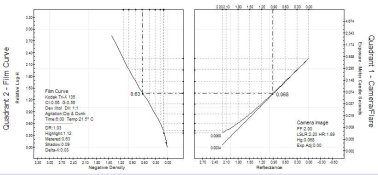
It's a well established fact that average flare for modern lenses is from 1 to 1 1/3 stops. Do the math with the CIs for normal. The only way to get 0.56 to 0.60 for normal is to factor in at least a stop of flare or assume a negative density range that doesn't correlate with the paper LER. Check out my four quadrant curves (they're not fiction). Everything points to at least one stop of flare. Look, it took me years to understand this to the extent that I do now. I don't expect anyone to nail it in a weekend.
Chuck, I've made some scans of some of the key papers on photographic theory and have a standing offer to share them with anyone interested. I'd be happy to send a few your way if you want.
You're currently doing paper testing. How are you reconciling the differences in the LERs between your aim and sensitometry's? Grade 2 has an LER of 1.05 and you want to fit a 1.30 or 1.20 negative into it? If you think about it with an open mind, there's really only one conclusion that makes sense.
Last edited by a moderator:
- Joined
- Feb 9, 2010
- Messages
- 9,544
- Format
- 4x5 Format
I'm looking at a negative range of 1.36 measured by densitometer, that fits a diffusion enlargement from paper white 0.01 to 1.86 for Grade 2 Ilford Galerie in Dektol 1:2.
I would have to choose, as an aim point, the step where the white reads 0.07 to be talking about LER 1.05
I can tell that if highlights on my negatives read 1.60 on the densitometer I would need to go to Selectol Soft because at around that point I leave the potential range of the paper.
I would have to choose, as an aim point, the step where the white reads 0.07 to be talking about LER 1.05
I can tell that if highlights on my negatives read 1.60 on the densitometer I would need to go to Selectol Soft because at around that point I leave the potential range of the paper.
That the curve, in fact, is slightly contrasty and needs to come down some to match the 2.10 log-H range to the aim negative density range of 1.20.
Yes, that curve represents just the speed test using the manufacturer's ISO and a guessed at development time. As it is, it represents too much contrast. So, after determining the speed with this curve (which turned out to be 100, full box speed), I would then expose another tablet at the tested speed (100) and reduce the development time to lower that curve so that it reaches a Zone VIII density of 1.3.
The attachment shows the family of curves and that the "N" curve is lowered to the 1.3 density line at Zone VIII by reducing development from 9:30 that I used in the speed test to 8:00. In my post #47, I put a note at the bottom indicating that the final development time for "N" was reduced to lower that curve to where it needed to be to represent my aim density range of 1.2.
Attachments
Last edited by a moderator:
OP
OP
I guess I should have asked how to "reconcile the theory".
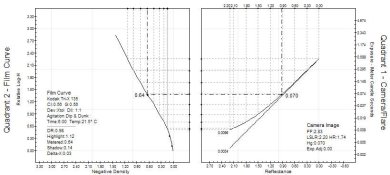
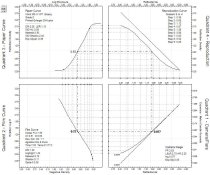
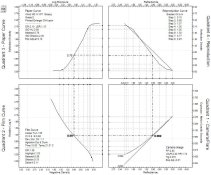
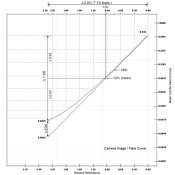
I always include a Max LER which is from paper D-min to D-max and depending on the paper, the difference can be rather large. I've attached an example of two paper curves with different shaped shoulders which created very different Max LERs for papers with the same standard LER.
The ISORs are based on psychophysical tests that produced the highest number of first quality prints. But that doesn't account for everything. Personal taste, effect, and subject matter all contribute. According to the four quad example, in order to get a negative with a density range of ~1.36 from an average subject, the negative would have to be processed to a CI of 0.80. You can also see how that range fits onto a paper with an LER of 1.15.
Here's a thought. The average scene luminance range, negative density range, and paper LER doesn't take into account what is called accent tones. Those are deep blacks or Zone 0 if you will, and varying degrees of specular highlights. The standard model uses 100% reflectance for the highlight which contains some specular values, but skies and reflections can produce much higher values. The average scene is 7 1/3 stops, but with the accents, you actually have around a 9 stop scene (see 9 stop luminance range example). A simple reading of the entire density range of a negative could account for the apparently high negative density range fitting on a paper with an LER 1.10.
There's simply not enough information to come to any conclusions. On a side note, I am a little surprised at the differences in the tone reproduction curve (Quad 4) between the two examples.
Attachments
Last edited by a moderator:
You're currently doing paper testing. How are you reconciling the differences in the LERs between your aim and sensitometry's? Grade 2 has an LER of 1.05 and you want to fit a 1.30 or 1.20 negative into it? If you think about it with an open mind, there's really only one conclusion that makes sense.
I feel like that I am coming to the conclusion that with VC paper, it is only important that my aim negative density range is one that puts my negative in a good position to take the best advantage of the paper's range of exposure scales that are possible with my enlarger, paper developer, toner.
The Oriental VC-FBII paper that I have says that the ISO Range goes from an LER of .4 to 1.8 or R40 to R180. If my negative density range is established in the area of a "hard" grade 1 (LER of 1.2) or a "soft" grade 2 (LER 1.1) then I feel good about that.
Indeed, my aim density range of 1.2 seems to put my negatives in a good place within the range of exposure scales when I use Ilford's MGIV FB paper.
- Joined
- Feb 9, 2010
- Messages
- 9,544
- Format
- 4x5 Format
With VC paper you have a more flexible aim point than me. Your goal to land somewhere between LER 1.1 to 1.2 sounds like a good idea to write down.
I have these factors to consider:
Paper availability limited
Scale Index for grade different than the rest
Densitometer gives readings without flare
Diffusion enlarger
Enlarger Flare with an older lens
I like using graded papers. I feel like I am going to have to pick my own aim point between Galerie 2 and Galerie 3 because those grades are available. AA aimed for negative printable on his favorite brand Grade 2. Galerie doesn't follow standard grade spacing.
I just noticed Todd/Zakia recommend using 0.04 to 90% of paper dMax. And this afternoon I noticed significant dust haze over my enlarger lens. So I may need to run another test.
OP
OP
Okay, I'm beginning to get the impression that I may not have emphasized a critical part of the Zone System vs Tone Reproduction testing methods in regard to negative density range. If you follow both methods, you will produce negatives with almost identical CIs. It's the same contrast negative. As the negatives are almost identical, they will produce almost identical results from the same subject ie identical density ranges. The question is not about the method that produces the best negative because the results are almost identical. It is about the method that best describes the process.
Last edited by a moderator:
Film speeds would be one stop slower without flare.
That is what does not seem right (independent of any 'flashing' effect on reciprocity of the low values).
So my premise is that fog only changes the scene contrast range and has no effect on optimum exposure. I'll have to look into it some more to determine if that is the case or not.
In terms of the flare as 'non image forming' that is just to emphasize that it is identical to fog. You can see the flare would have no image by mathematically subtracting the image from the image plus flare (easy to do in the digital domain). What would be left would be indistinguishable from fog. Flare exposes the film but it has no image itself.
Ok, check this out. The graphs posted in #59 above are a good example. By flipping back and forth between them it is clear that the increased flare compresses the low values on the negative making less separation between them. So, if you then reduce exposure (in the high flare case) there will be further compression to the values as they get closer to the toe.
The definition of a speed increase is an increase in tonal separation in lower values. The case of adding flare (or increasing flare) will decrease low value separation. This will be made worse with less exposure. So, based on that example, flare does not increase exposure index (and in fact it decreases the speed of the system).
The definition of a speed increase is an increase in tonal separation in lower values. The case of adding flare (or increasing flare) will decrease low value separation. This will be made worse with less exposure. So, based on that example, flare does not increase exposure index (and in fact it decreases the speed of the system).
OP
OP
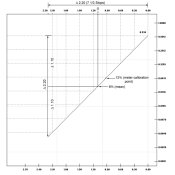
As the thread has included a lot of talk about flare, I want to present another example of explain another point of theory thanks to the help of flare - Defining middle gray. There are at least three categories of middle grays: the psychophysical or how we see, the physical world, and the camera (the meter may or may not constitute a separate category. I'm sure everyone has hear 8%, 9%, 12%, and 18% thrown around. Believe it or not flare is able to make sense of all these values.
The first step to finding the solution is think about it from a photographic standpoint. It's not as much about the scene as the image of the scene and that means the camera image. The average photographic scene has a luminance range of 2.20 logs with the highlight (not specular/accent highlight) and range beginning at 100% reflectance (RD 0.00). Split that in half and you have two log 1.10 ranges. 1/antilog(1.10) = 8%. If you round the luminance range to 7 stops, you have two 1.05 log ranges which is 9%. This can be considered the middle gray for the physical world or a non flare image of it. The example "No Flare" illustrates this.
People are finally coming around to the meter's middle gray being 12% (meters don't read percentages but I don't want to get into that). Although the reason why is usually in question especially when 100% reflectance falls approx 0.94 logs above the metered point and the shadows fall 1.28 logs below. It isn't even, or it isn't until you introduce flare. The average value of flare used for cameras is 1 1/4 stops or a log .34. Flare affects the shadows, so 0.34 from 1.28 equals .94 which makes both sides of the metered exposure equal. See example "Normal Flare".
Finally, 18% could have come from the higher flare produced by the older uncoated lenses. See the example "Two stops Flare."
Attachments
OP
OP
I just noticed Todd/Zakia recommend using 0.04 to 90% of paper dMax. And this afternoon I noticed significant dust haze over my enlarger lens. So I may need to run another test.
That's the standard, as in ANSI/ISO standard.
- Joined
- Feb 9, 2010
- Messages
- 9,544
- Format
- 4x5 Format
The 18% solution sure makes sense Stephen, thanks. By the way - when or where did the K factor come in and what's its purpose. I believe it either nulls out meter flare or attempts to compensate in some other way for the difference between meter and camera flare.
OP
OP
Flare exposes the film but it has no image itself.
Exactly!
So my premise is that fog only changes the scene contrast range and has no effect on optimum exposure.
Flare is almost exactly like flashing. Flare adds exposure to the camera image, so by it's very nature, it has an affect on exposure.
The definition of a speed increase is an increase in tonal separation in lower values.
This might be what's tripping you up. Tonal separation in the shadows determines what is perceived as a quality reproduction. The fractional gradient speed method determines the minimum point where that is possible.
I do see where you are going with this though. Flare will decrease the gradient of the shadow values thus degrading image quality. But it won't change the determination of the film speed. Film speed is determined through contacting the film so the it is a non-flare film curve; however that doesn't mean flare isn't part of speed determination. The placement of the speed points (.3G for fractional gradient and 0.10 for ISO) have a direct relationship to the psychophysical testing for speed. The test consisted of judging the quality of prints, and as those images where made with cameras, flare was considered as part of what determined quality. The 0.3x the film's average gradient is basically a higher gradient then will be produced in the finished negative that produces an "excellent" quality image. Flare is a factor, it's just not obvious from reading the standards because the purpose of the standards isn't to argue theory but to describe how to do something.
The ISO standard's speed point of 0.10 falls only 3 1/3 stops below the metered exposure point while the shadow falls 4 1/3. It is assuming a one stop flare factor and projecting the affect onto a film curve that excludes flare by placing the speed point one stop higher than where the average shadow would fall. This is very much the concept of the Zone System vs Tone Reproduction negative density range dilemma. Sorry, I know I'm not describing this very well.
In shooting conditions, conceptually the film's effective film speed will be higher shooting a high flare scene and lower in low flare conditions. Flare makes absolute control over exposure and the negative impossible. I tend to be quite amused with those who claim otherwise.
___________________________
After some additional consideration ...
I now think I have a handle on what you're saying. Any flare higher than the average flare will alter the relationship between the amount of addition exposure from flare and it's affects on the increase of film speed if you consider speed as a product of gradient and not density. It's like flare / image quality reciprocity. I would have to say from that position, film speed would still increase but at a slower rate. Let's say an additional one stop flare will only increase the effective film speed 1/2 stop. Sounds good to me.
So how concerned should we be and what can be done about it. First consider how high flare can be. I'll have to look that one up. Second, the fractional gradient speed method was determined when average flare was 2 stops. That would mean we have a stop quality flare safety factor. Third, there's isn't much you can do about flare that isn't out of image producing flare except through printing and increasing film processing. Fourth, how flare can you take the adjustments before the image doesn't look right. Certain scenes won't look natural without a little flare look.
Last edited by a moderator:
OP
OP
The 18% solution sure makes sense Stephen, thanks. By the way - when or where did the K factor come in and what's its purpose. I believe it either nulls out meter flare or attempts to compensate in some other way for the difference between meter and camera flare.
I swear I did not pay Bill to bring up one of my favorite topics. I don't want to scare you, but to do it right, it could take some time. Are you willing to start a new thread on the topic of K? Truthfully, once you understand K, you understand camera exposure, film speed, and the exposure meter and how they all interrelate.
| Photrio.com contains affiliate links to products. We may receive a commission for purchases made through these links. To read our full affiliate disclosure statement please click Here. |
PHOTRIO PARTNERS EQUALLY FUNDING OUR COMMUNITY:  |