Derek and albada are using the that wordology, as if there's some kind off error that needs fixing........I'm just trying to follow along since I now own a PD.
Maybe I used the wrong terminology, or we're simply mincing words over definitions of terms. So let's stop using the word "error," but rather "difference from expected value." Yes, by the dictionary definition, that's the same thing, but a lot of this conversation is really about trying to find out what the expected value should actually be.
In any case, the "difference" you've uncovered is not a difference in how correctly various instruments are doing their job. Its a difference in how other people have measured the same materials you're using for calibration and testing.
If you want the PD to give readings that more closely match the calibrated step wedge you just bought from Stouffer, then use the step wedge you just bought from Stouffer as the calibration reference.
If you want the PD to give readings that more closely match the calibrated step wedge that I bought from Stouffer a year and a half ago, then use the step wedge I included with the unit as the calibration reference.
In any case, Nicholas explained some of the factors best in post #56, so I'll add my comments to a few snippets from it:
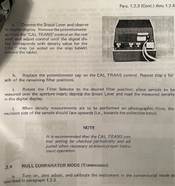
Programming this multiplicative 'fudge factor' into the densitometer is what transmission densitometer calibration is all about. The calibration is there to compensate for differences in spectral response and optical geometry between the factory's reference unit and yours. In the bad old days of analog logarithmic converters the calibration procedure was also there to correct for drift in the electronics and if you have one of these older models then frequent calibration checks are in order.
This. Modern sensors and LED-based light sources do not really have much of a drift problem, but there are still a number of variables that do need calibration to get the expected results.
The "target calibration" process (what's been discussed above) is basically measuring an unobstructed light source, assuming its density is 0.00, then measuring a "dark" target, and assuming its density is whatever you tell it. It then does the math to see where the things you're actually measuring with the device fall in relation to those two values, on a logarithmic scale.
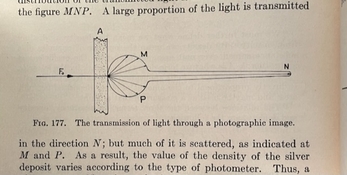
If we don't involve calibration, and assume perfect equipment, then transmission density is essentially defined as:
D = -log
10 T
Where "T" is defined as the ratio of light detected by the sensor as passing through the target material, to light that would be detected if the path from the light source to the sensor was unobstructed.
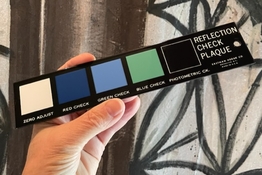
Reflection densitometry is a bit more complicated as you need a reference white sample and you really need Ulbricht spheres for the source and the detector.
Reflection is actually both easier and harder.
Its easier, because there seems to be far less variation in how accurately the calibration materials are measured and how many options for them exist. Not only can you buy calibrated references from Stouffer and X-Rite (that agree with each other), but you can also buy laboratory grade reflection references that are pretty good as well. Furthermore, the market for new high-end reflection-only densitometers is far larger and still meaningfully exists, thanks to various printing industries.
Its harder because "0.00" is theoretically defined, so you have to calibrate against both "white" and "dark" reference materials. And yes, if you want to measure a surface with complex textures, you do need an integrating sphere as part of the setup. But normal densitometers intended for photographic purposes don't do that, as ISO 5-4:2009 just mentions having a 45 degree angle between the sensor and the light source. (The massive benchtop Spectrophotometers from X-Rite do use an integrating sphere, though.)