alanrockwood
Member
- Joined
- Oct 11, 2006
- Messages
- 2,198
- Format
- Multi Format
I am not sure if this post goes best in the exposure section of the darkroom section.
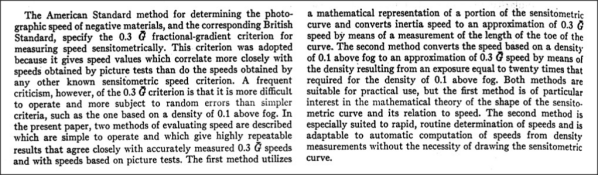
I understand that early-on Kodak folks considered the best choice for speed point would be where the slope of the characteristic curve is 1/3 of gamma. Later they joined the rest of the world and went with a density of 0.1 over base plus fog as choice of speed point.
I suppose for a short toe film there's probably not much difference, but for a long toe film it might make a difference. If so, and if one could do accurate measurements of the slope of the characteristic curve (admittedly a challenge), for determining one's personal film speed (EI), would 1/3 gamma be a better choice than 0.1 over base plus fog? Intuitively it seems to me that it would be a better choice.
When I mentioned a short toe film it is based on the idea that if the curve was a straight line with a perfect break to zero slope at the toe (i.e. no toe) there would be no difference between the two methods. That's why I speculate that for a short toe film the two choices are probably not much different.
Opinions?
 "Delta-X Criterion"