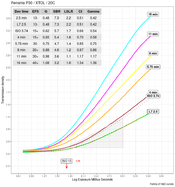
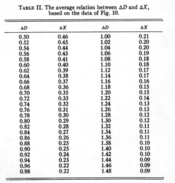
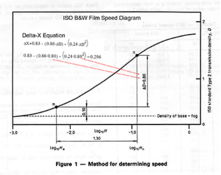
Personally, I am not using ΔX, but I programmed the option in so the user can decide whether to use it or not. Currently, it can be applied to any curve individually or all in the family. It can also be applied to curves that are not in the family, but can be predicted to be part of the family, such as LSLR=2.2, SBR=7, Ḡ=0.62, etc. It can be useful to see how different curve shapes, toes, slopes affect the interplay among parameters, such as CI, Gamma, ΔX, ΔD, etc. I am still trying to figure out the best way to present the data so that the plots do not appear too busy, esp. on mobile devices with limited screen real estate. I still have a lot of work to do. It will be months before I have anything to show.So which curve in each are you applying ΔX to?
One other thing that I think can be useful to photographers is seeing how particular curves of interest, such as for a "normal" scene luminance or "normal" in the sense of CI, fit into the family of curves. Here, my program synthesized two extra curves, as an example, one, marked "L7" and one marked "ISO." By coincidence, the L7 and the 2.5 minute curves coincide (sorry about the pun), except that the 2.5 minute curve is actual, whereas the "L7" curve is synthetic. Nevertheless, they share the same values of all the parameters of interest and the same overall tonality. This is possible because of the statistical model of the characteristic curve used here. It fits the data quite well. The ISO curve was generated the same way. The synthetic curves are plotted with dotted lines.


