Stephen Benskin
Member
Where a curve is measured can result in different gradient values. Gradient is a function of the degree processing has on the densities of the film. The problem is where to measure the curve to determine the gradient value. The most obvious answer would be the area of usage, but even that can have its difficulties when considering factoring in flare or not. Another is to use the average exposure range and assume the curve is relatively consistent enough to apply to other exposure ranges. This can work well for short toed curves with their long linear curves, but not so with long toed curves, where the point of measurement can be more critical.
At this point I dont want to make any judgments as to the best gradient method. I just wish to illustrate how the value is effected by the type of curve and where it is measured.
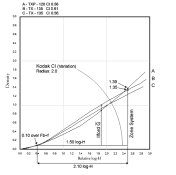
The first example has three curves. Using the Contrast Index method, Curves A and C are the same contrast. Curve B is slightly higher. Depending on where the curve is measured, A can have a higher gradient than B.
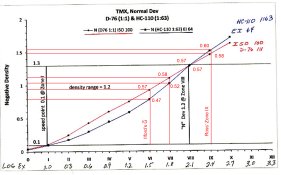
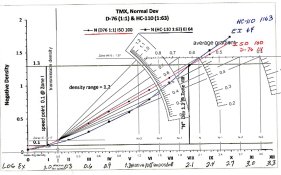
The following examples come from a graph uploaded by Chuck. Im using it only because it is an excellent example of a short toed curve and a long toed curve that come together at one of the points measured. At the Zone VIII log-H indication (2.10 log-H range), they both have a density of 1.30 (1.20 density range over 0.10 Fb+f). If measured from this point, the two curves will have the same gradient. But what about other points.
The first example shows Alan Ross Zone IX method (2.4 log-H range), Ilfords Average Gradient Method (1.50 log-H range), and a check at a range of 1.80 log-H.
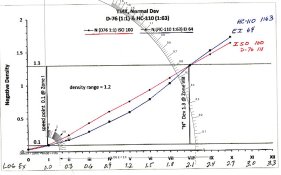
The next two use the Contrast Index template. The template is moved back and forth along the curve until the gradient in the small arc matches the gradient in the larger arc.
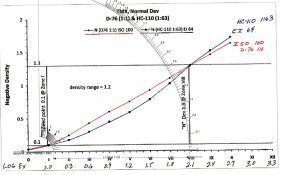
The last two examples comes from the template in Beyond the Zone System. This template has a series of tiered arcs to accommodate longer scene luminance ranges. Instead of a smaller arc in the toe, it uses a fixed density point of 0.17 over Fb+f.

At this point I dont want to make any judgments as to the best gradient method. I just wish to illustrate how the value is effected by the type of curve and where it is measured.
The first example has three curves. Using the Contrast Index method, Curves A and C are the same contrast. Curve B is slightly higher. Depending on where the curve is measured, A can have a higher gradient than B.

The following examples come from a graph uploaded by Chuck. Im using it only because it is an excellent example of a short toed curve and a long toed curve that come together at one of the points measured. At the Zone VIII log-H indication (2.10 log-H range), they both have a density of 1.30 (1.20 density range over 0.10 Fb+f). If measured from this point, the two curves will have the same gradient. But what about other points.
The first example shows Alan Ross Zone IX method (2.4 log-H range), Ilfords Average Gradient Method (1.50 log-H range), and a check at a range of 1.80 log-H.

The next two use the Contrast Index template. The template is moved back and forth along the curve until the gradient in the small arc matches the gradient in the larger arc.


The last two examples comes from the template in Beyond the Zone System. This template has a series of tiered arcs to accommodate longer scene luminance ranges. Instead of a smaller arc in the toe, it uses a fixed density point of 0.17 over Fb+f.


Last edited by a moderator:


