Hiding in Plain Sight

about to extinct

D
about to extinct

  • 0
  • 0
  • 52
Fantasyland!

D
Fantasyland!

  • 9
  • 2
  • 119
perfect cirkel

D
perfect cirkel

  • 2
  • 1
  • 124
Thomas J Walls cafe.

A
Thomas J Walls cafe.

  • 4
  • 8
  • 298

Recent Classifieds

Forum statistics

Threads
198,747
Messages
2,780,303
Members
99,693
Latest member
lachanalia
Recent bookmarks
0
Joined
Jan 7, 2005
Messages
2,612
Location
Los Angeles
Format
4x5 Format
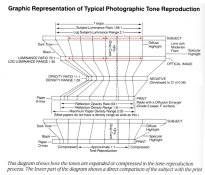
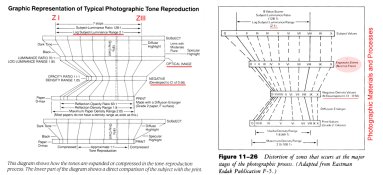
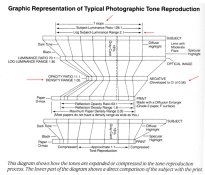
The Kodak Graphic Representation of Typical Photographic Tone Reproduction diagram is fairly well known. I’ve always found it to be a excellent illustration of the photographic process, but it contains a lot of information, and sometimes important details can get overlooked. There's a concept hiding in plain sight.
Kodak tone reproduction graphic.jpg

Looking at the diagram, it has a 7 stop range for the subject (log subject luminance range 2.10). And it has a negative density range of 1.05 when the film is developed to a CI of 0.56. According to the equation for slope, Rise/Run, that should be 1.05 / 2.10 = 0.50 and not 0.56. By the looks of things, 0.56 would be over-processing it a bit.
 

Bill Burk

Subscriber
Joined
Feb 9, 2010
Messages
9,290
Format
4x5 Format
It's flare all right, the CI was calculated using the image at the film plane which includes flare: 1.05 / 1.85 is about 0.56
 

pgomena

Member
Joined
Jun 25, 2003
Messages
1,391
Location
Portland, Or
Interesting also that the dotted line representing 18% reflectance is at the high side of middle gray. This bolsters a post from a few weeks back that 12% reflectance value is perhaps a better value for calibrating Zone V than 18%. Fascinating. I've known about that chart for 20 or more years and never noticed.

Peter Gomena
 
OP
OP
Stephen Benskin
Joined
Jan 7, 2005
Messages
2,612
Location
Los Angeles
Format
4x5 Format
Interesting also that the dotted line representing 18% reflectance is at the high side of middle gray. This bolsters a post from a few weeks back that 12% reflectance value is perhaps a better value for calibrating Zone V than 18%. Fascinating. I've known about that chart for 20 or more years and never noticed.

This kind of thing happens to me all the time. Once something is pointed out, I keep seeing it everywhere. Every once in a while, I'll go back through a book and suddenly see all these references that I hadn't noticed the last dozen or so times I had read it. This happened recently when doing the speed/exposure meter relationship thread. I was reviewing a few papers and a couple chapters and I kept seeing all these references to the relationship. And not long ago, I kept running into the phrase "good correlation" between the fractional gradient method and the fixed density film speed. It was used so often in so many sources that it almost seemed like some kind of well known code for something. I was surprised to see it in so often with what I had read and re-read so many times without it ever registering before.
 
OP
OP
Stephen Benskin
Joined
Jan 7, 2005
Messages
2,612
Location
Los Angeles
Format
4x5 Format

It's flare all right, the CI was calculated using the image at the film plane which includes flare: 1.05 / 1.85 is about 0.56

Fine, maybe it wasn’t hiding very well.:smile: But let’s take a look at the value of the negative density range – 1.05. That falls right in the center of the grade 2 paper LER range.
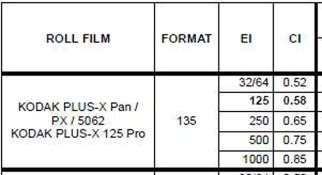
Kodak has a negative density range of 1.05 using a CI of 0.56. This diagram has been frequently reproduced. Kodak’s technical data sheets also use 1.05 and CI 0.56 (more recently CI 0.58). Many books and publications have this value. Many books show how flare reduces the scene’s apparent luminance range within the camera. How a 7 1/3 stop scene is reduced to a 6 1/3 or even 6 stop exposure range at the film plane. The log exposure ranges for various grades of paper are also reproduced in books and publications. A grade 2 is generally listed as being from an LER of 0.95 to 1.14. That fits in perfectly with the 1.05 negative density range.

These numbers are reproduced over the place. It’s hard to miss them, so why do people still insist on negative density ranges of 1.20 to 1.35? Shouldn’t the difference between the two sets of numbers at least create some questioning in people’s minds? The information is right there. How can it be missed? I thought it all had to be hiding in plain sight. Maybe by pointing out these values, they will suddenly appear and become noticeable in all those books and publications.
 
Last edited by a moderator:

Bill Burk

Subscriber
Joined
Feb 9, 2010
Messages
9,290
Format
4x5 Format
These numbers are reproduced over the place. It’s hard to miss them, so why do people still insist on negative density ranges of 1.20 to 1.35?

Saw this again today and right about the time I was going to say - no don't develop to 1.2 - I realized you are supposed to overrun by about 0.1

---
Guess why? I'm thinking flare again.
---
I think enlarger flare is going to take that 0.15 off the negative density range and leave you with 1.05 on the paper.
 
OP
OP
Stephen Benskin
Joined
Jan 7, 2005
Messages
2,612
Location
Los Angeles
Format
4x5 Format
Saw this again today and right about the time I was going to say - no don't develop to 1.2 - I realized you are supposed to overrun by about 0.1

---
Guess why? I'm thinking flare again.
---
I think enlarger flare is going to take that 0.15 off the negative density range and leave you with 1.05 on the paper.

Flare does play a factor in printing, but I believe the LER to negative density range is off set by the Callier coefficient.

The answer is flare, but it's still the camera flare. The short answer is:

2.10*0.56 = 1.17
2.10*0.58 = 1.22

2.20*0.56 = 1.23
2.20*0.58 = 1.28
 
OP
OP
Stephen Benskin
Joined
Jan 7, 2005
Messages
2,612
Location
Los Angeles
Format
4x5 Format
It’s a simple case of misinterpreting the data. The exposure range is smaller than the scene luminance range do to the effects of flare. We know that flare affects the shadows to a greater proportion than the highlights. Flare reduces the exposure range between the metered exposure and the shadow exposure. It shifts the shadow exposure toward the metered exposure.

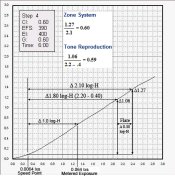
But when testing for negative contrast, it is common to use the speed point as the base point to calculate the film gradient. In the example below, the film is processed to a CI 0.60 which is slightly higher than the standard model, but fits the ideal Zone System model (CI 0.595).

Zone NDR example.jpg

The difference between the two values for the negative density range of 1.06 and 1.27 is the difference in the range from the shadow to the highlight exposure. One uses a seven stop scene luminance range and the other a 7 1/3 stop scene luminance range to begin with, but factors in a 1 1/3 stop flare factor making for an exposure range of 1.80. (To simplify the comparison, you can also think of it as a 7 stop scene luminance range with one stop flare.)

The difference in ranges come from measuring different points on the same curve. But conceptually, one is recognizing the difference between the scene luminance range and the camera exposure range and one is not.
 
Last edited by a moderator:
OP
OP
Stephen Benskin
Joined
Jan 7, 2005
Messages
2,612
Location
Los Angeles
Format
4x5 Format
Here’s something else interesting hiding in the diagram. Remember in the speed/meter relationship post when I said that the average scene highlight falls 3 stops above the metered exposure and the average shadow falls 4 1/3 stops below, but in camera with the effects of flare, they balance out making the metered exposure the mean?

Kodak tone reproduction graphic a.jpg

The four red arrows are the same length. They are based on the distance between the highlight point and three stops down (which can be considered the metered exposure point) in the Subject representation. With the Optical Image, this relationship hasn’t changed, but the distance between the metered exposure point and the shadow exposure is reduced almost to the same three stop difference. I have to admit it's not perfect in this example because the amount of flare they use is slightly lower than average. I believe they had to "fudge" some in order to make the rounded 7 stop range (instead of 7 1/3 stops) fit into the 1.05 negative density range.
 

ic-racer

Member
Joined
Feb 25, 2007
Messages
16,544
Location
USA
Format
Multi Format
Thing I point out to folks when studying any graphic representation of the B&W film and paper tone reproduction cycle is the gross distortion of values, even in the best of situations. The prints out of a typical 'creative' darkroom are likely going to demonstrate a tone reproduction cycle even more distorted than that presented. The point I make is that B&W film/paper is a creative medium and a beginner's naive attempts to 'reproduce reality' will be futile.

The other thing I point out is that the "S" and "J" portions of the film and paper account for this, and as Steve has shown, flare distorts things also. It is possible to make 'flare-insignificant' images with small format, multicoaed lenses in low contrast scenes. The tonal reproduction curve is still going to be buggered up because neither the film or paper are straight-lined.
 
Last edited by a moderator:
OP
OP
Stephen Benskin
Joined
Jan 7, 2005
Messages
2,612
Location
Los Angeles
Format
4x5 Format
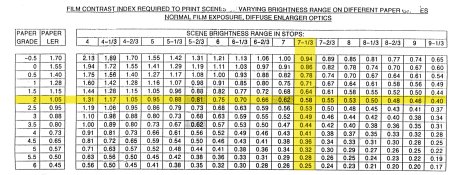
This CI / NDR Chart was an internal reference used at Kodak under Dick Dickerson. For a grade 2 paper with a negative density range of 1.05, a 7 1/3 stop scene luminance range should be processed to a contrast index of 0.58. This is slightly different from the Kodak diagram because the use a different value for flare.

Contrast Indexes - Kodak - Diffusion .jpg

1.05 / (2.2 – 0.40) = 0.58

If flare isn’t factored in, then the resulting CI for the same set of conditions would be:

1.05 / 2.2 = 0.48

A CI 0.48 falls on the chart at a scene luminance range of 8 2/3 stops. That’s a 1 1/3 stop, or log 0.40, difference. The same difference between the scene luminance range and the camera exposure range.

For 7 1/3 stop luminance range
(2.20 - 0.40) * 0.58 = 1.05
2.20 - 0.58 = 1.276

For 8 2/3 stop luminance range
(2.60 - 0.40) * 0.58 = 1.276
(2.60 - 0.40) * 0.48 = 1.05
 
Last edited by a moderator:
OP
OP
Stephen Benskin
Joined
Jan 7, 2005
Messages
2,612
Location
Los Angeles
Format
4x5 Format
But wait. Here's contrast index values from the Xtol information data sheet that use different values.

Kodak Data sheet excerpt - processing aims.jpg

The data sheet vs Kodak's CI/NDR Chart

N - 0.58, 0.58
+1 - 0.65, 0.70
+2 - 0.75, 0.88
+3 - 0.85, 1.17

Why the difference? One is for adjusting for different luminance ranges and one is for adjusting for under exposure. In other words, pushing for contrast vs pushing for speed. For pushing for speed, the scene luminance range remains constant, but the exposure is shifted to the left. This lowers the negative density range as the shadows drop further down into the film's toe. Increasing processing increases the the contrast of the film making up for the loss from under exposure. It also increases density in the toe. This effectively increases the film speed. The general rule of thumb is a stop increase in contrast increases the "speed" 1/3 stop. A film under exposed one stop and push processed results in only a 2/3 stop under exposure. In order to match the same density range as a normally exposed and processed film, the under exposed film is processed 2/3 of a stop contrast for each 1 stop under exposure.

The difference between pushing for contrast and pushing for speed is that the difference between the steps for pushing for contrast is 0.30, while the difference between pushing for speed is 0.20.

Contrast Indexes for pushing for contrast vs pushing for speed

N
1.05 / (2.20 - 0.40) = 0.58
1.05 / (2.20 - 0.40) = 0.58

N+1
1.05 / (1.9 - 0.40) = 0.70
1.05 / (2.0 - 0.40) = 0.656

N+2
1.05 / (1.60 - 0.40) = 0.88
1.05 / (1.80 - 0.40) = 0.75

N+3
1.05 / (1.30 - 0.40) = 1.17
1.05 / (1.60 - 0.40) = 0.875

All the answers are out there. They're just slightly hidden in plain sight.
 
OP
OP
Stephen Benskin
Joined
Jan 7, 2005
Messages
2,612
Location
Los Angeles
Format
4x5 Format
A version of the Kodak diagram can be found in Way Beyond Monochrome. It can be found online: http://www.waybeyondmonochrome.com/WBM2/TOC_files/ToneReproductionEd2.pdf

WBM Tone Reproduction Diagram.jpg

At first glance it appears to contain the same data as the Kodak diagram but with a Zone System emphasis. They both have a Subject line, an Optical Image line, a Negative line, and a Print line. Both have a 7 stop scene luminance range for the subject. Way Beyond Monochrome’s negative is developed to CI 0.57 which is almost identical to Kodak’s CI 0.56.

With all due respect, where they differ is with the resulting negative density range. Way Beyond Monochrome has a NDR of 1.20 for a 7 stop scene with the film processed to CI 0.57. Kodak has a NDR of 1.05 for a 7 stop scene with the film processed to CI 0.56. How is it possible to have different resulting negative density ranges from almost identical conditions?

While the Way Beyond Monochrome diagram shows the effects from flare in the Optical Image, just like the Kodak diagram, it doesn’t factor it into the equation for the resulting negative. This is confirmed in another part of the book, Testing Film Speed and Development, http://www.waybeyondmonochrome.com/WBM2/Library_files/FilmTestEvaluation.pdf.

“In addition, we also sets the normal log exposure range to 2.10, since we need 7 subject brightness zones to expose the 7 paper zones above, and each zone is equivalent to 0.3 log exposure. The normal average gradient can be calculated as 1.20 / 2.10 = 0.57. “

The desired negative density range is divided here by the scene luminance range, and not the camera exposure range. Both the Way Beyond Monochrome diagram and the Kodak diagram show the existence of flare in their models. It’s impossible to get different negative density values from the same set of conditions. In order to acquire a desired negative density of 1.20 under the conditions displayed, for the Way Beyond Monochrome negative needs to be developed to a CI of 0.67.

1.20 / (2.1 – 0.30) = 0.67
 
Last edited by a moderator:
OP
OP
Stephen Benskin
Joined
Jan 7, 2005
Messages
2,612
Location
Los Angeles
Format
4x5 Format
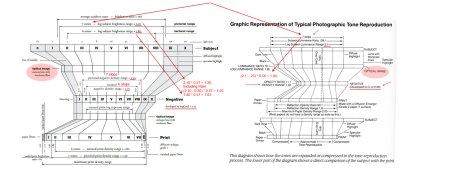
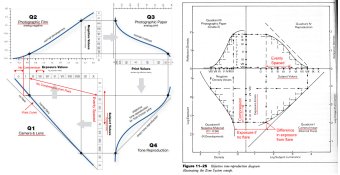
Here is a comparison between the Kodak tone diagram and one from Photographic Materials and Processes. Like Way Beyond Monochrome, it uses Zones. Both use a seven stop scene luminance range, average flare, and process the negative to a CI 0.56.

Kodak tone diagram and Materials tone diagram.jpg
 
OP
OP
Stephen Benskin
Joined
Jan 7, 2005
Messages
2,612
Location
Los Angeles
Format
4x5 Format
This is a comparison between tone reproduction diagrams. The one on the left is from Way Beyond Monochrome and the right is from Photographic Materials and Processes.

WBM and Materials 4 Quad.jpg

In both the WBM and Materials diagram, flare in Quadrant I has pushed the shadow exposure higher up on the film curve, Quadrant II. The major difference is the Materials diagram shows how flare compresses the darker tones, between Quadrant I and Quadrant II, while WBM shows no change.

Both examples also show how the Zone designations are associated with the original subject and not to any specific negative density based on the exposure range from the speed point. This is most noticeable in the Materials diagram with the Zone designations remaining constant even though the exposure range for the shadows is compressed.
 
Last edited by a moderator:
OP
OP
Stephen Benskin
Joined
Jan 7, 2005
Messages
2,612
Location
Los Angeles
Format
4x5 Format
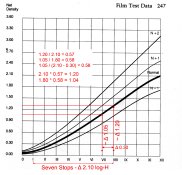
Even though there isn’t anything specifically about flare in The Negative, it’s still there if you know where to look. Appendix 2, Film Test Data, has a number of film curves from which it’s possible to tease out some information. While the hash marks make it impossible to determine precise density ranges, the concept isn’t lost.

TThe Negative - curve example.jpg

There is a seven stop range from Zone I to Zone VIII. The negative density range at Zone VIII from a density of 0.10 over Fb+f to where it crossed the film curve is approximately 1.20. The gradient of the curve is then 1.20 / 2.10 = 0.57.

In this example, there is no compression of the lower Zones and each Zone is placed along the log-H axis at equal 0.30 (one stop) intervals. Incorporating a one stop flare factor will reduce the exposure range from 2.10 logs to 1.80 logs. The film’s contrast gradient hasn’t changed, but one value represents a negative density range resulting in a unrealistic non-flare situation, and the other represents a more realistic situation as all optical systems have flare. It also conforms to the middle of the paper LER range for a grade 2 paper, as well as information from Kodak and other publications.
 
Last edited by a moderator:
OP
OP
Stephen Benskin
Joined
Jan 7, 2005
Messages
2,612
Location
Los Angeles
Format
4x5 Format
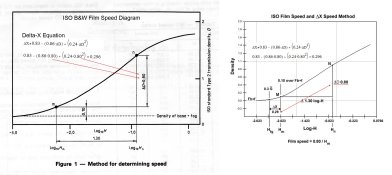
The diagram on the left is from ISO – 6 Black and white pictorial still camera negative film / process systems – Determination of ISO speed. While it doesn’t say in the standard, the reason why the specific contrast parameters are used is because they are part of an equation that links the fixed density method of speed determination with the fractional gradient method. The diagram on the right shows this relationship.

ISO Diagram.jpg

It’s possible to find the fractional gradient speed from any contrast simply by plugging the negative density range at 1.30 log-H units from the speed point into the Delta-X equation. The reason why a density range of 0.80 was chosen is because of the relationship between the speed point / metered exposure ratio and the average scene luminance range (See What is the Relationship Between Film Speed and the Exposure Meter thread).

When the ISO contrast parameters are met, it’s not necessary to do the actual calculation to find the value for Delta X. Because the equation isn’t required to determine the ISO Delta X value, it’s not included in the standard.

The contrast parameters of the ISO standard are about creating a good correlation between the fixed density method and the fractional gradient method. It does not represent and has nothing to do what some call ISO normal development.

I have to admit, this one is a little more hidden.
 
Last edited by a moderator:

Bill Burk

Subscriber
Joined
Feb 9, 2010
Messages
9,290
Format
4x5 Format
This thread gets me thinking something else might be hiding in plain sight.

Could aligning "Sunny 16" to metered readings have had something to do with speed point and/or speed point / metered exposure ratio decisions?
 

Bill Burk

Subscriber
Joined
Feb 9, 2010
Messages
9,290
Format
4x5 Format
How do you mean?

My hypothesis is that, in part, light meters were calibrated to confirm the rule of thumb that in bright daylight with shutter speed set at the (reciprocal of) EI, an aperture of f/16 gives correct exposure.
 
OP
OP
Stephen Benskin
Joined
Jan 7, 2005
Messages
2,612
Location
Los Angeles
Format
4x5 Format
Do you mean like these two excerpts from two exposure meter standards and plugging in some Sunny 16 numbers?

Exposure meter Calibration and Sunny 16.jpg

And here is the proof of the calibration luminance value and Sunny 16 exposure.

Exposure for Sunny 16.jpg
 
Last edited by a moderator:

Bill Burk

Subscriber
Joined
Feb 9, 2010
Messages
9,290
Format
4x5 Format
Stephen,

You wrote about the coincidence between Sunny 16 and standards in this thread...(there was a url link here which no longer exists)

It's worth revisiting the idea that Jones figured out how bright the sun is (to oversimplify) the same year the standards came to be.

I couldn't find the brightness of average daylight conditions in your proofs. Is it there?
 
OP
OP
Stephen Benskin
Joined
Jan 7, 2005
Messages
2,612
Location
Los Angeles
Format
4x5 Format
Stephen,

You wrote about the coincidence between Sunny 16 and standards in this thread...(there was a url link here which no longer exists)

It's worth revisiting the idea that Jones figured out how bright the sun is (to oversimplify) the same year the standards came to be.

I couldn't find the brightness of average daylight conditions in your proofs. Is it there?

I don't think it was much of a coincidence. Jones was chairman of the Z38 Section Committee, Photography of the American Standards Association from 1940 to 1950. I've also noticed a number of standards or revision of standards occurred shortly after a new paper was published. But I don't care what people say, I don't think Jones was trying to push through an agenda.

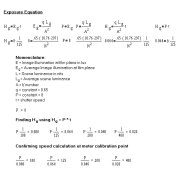
The proof for illuminance comes from the incident meter calibration equation.

A^2 / t = (I * S) / C

Using Sunny 16 and solving for I, it becomes I = 16^2 * C
According to the exposure meter standards, C = 30

256 * 30 = 7680 footcandles

The average reflectance between the illuminance of the incident meter and the luminance of the reflection meter is:

(297 * pi) / 7680 = .12

You can also calculate the average reflectance using the constants:

(1.16 * pi) / 30 = .12

According to the ANSI photographic exposure guide, "Daylight reaches a maximum illuminance of approximately 11,000 footcandles at a solar altitude of 90 degrees." The solar angle used for the measure is approximately 40 degrees. According to the standard, this is approximately 2/3 of a stop less light than the maximum.

I've done a little calculating and 11,000 footcandles at 90 degrees will yield 8426 footcandles at 40 degrees and 7778 footcandles at 45 degrees. For the illuminance to equal the incident exposure meter value of 7680 at 40 degrees, the maximum illuminance would have to be around 10,200 footcandles. I think that's only a tenth of a stop difference.
 
Photrio.com contains affiliate links to products. We may receive a commission for purchases made through these links.
To read our full affiliate disclosure statement please click Here.

PHOTRIO PARTNERS EQUALLY FUNDING OUR COMMUNITY:


Ilford ADOX Freestyle Photographic Stearman Press Weldon Color Lab Blue Moon Camera & Machine
Top Bottom