Film Speed from development times

sdeeR

D
sdeeR

  • 0
  • 0
  • 19
Rouse St

A
Rouse St

  • 1
  • 0
  • 25
Untitled

A
Untitled

  • 2
  • 1
  • 41
Today's Specials.

A
Today's Specials.

  • 3
  • 0
  • 41
Street portrait

A
Street portrait

  • 1
  • 0
  • 35

Recent Classifieds

Forum statistics

Threads
199,171
Messages
2,787,441
Members
99,831
Latest member
wota69
Recent bookmarks
0

tom williams

Subscriber
Joined
Jan 24, 2020
Messages
282
Location
Arizona
Format
4x5 Format
Greetings.

I wonder if anyone in the know could weigh in on a question about modifying film speed based on tested development times.

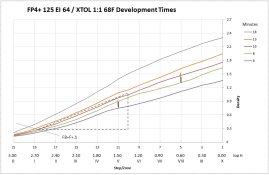
Background: A while back I determined an EI of 64 for FP4+ 4x5 film, developed in stock XTOL. A few days ago I exposed 5 sheets of film to a blank white target, in full sun, overlain by a 4x5 Stouffer step tablet, and developed them at times from 6 minutes to 18 minutes. The developer was XTOL diluted to 1:1, in contrast to the development of my speed test sheets with stock XTOL. I've attached a plot of density vs step (or Zone) for the development time test sheets.

I thought I would determine the optimum development time (for FP4+ EI 64 developed in XTOL diluted 1:1) by noting which curve intersected the vertical target bars at Zones V and VIII (the 4 small vertical bars. They cover Ansel Adams' suggested target densities for diffusion (orange bar) and condenser (black bar) enlargers). Obviously that didn't happen with the development times I selected, and I don't want to consider shorter development times than 6 minutes.

The data I used to determine speed indicate a linear progression in density vs exposure in the Zone V through Zone VIII interval, which is what makes me think that I can use these development test data to deduce a reasonably accurate film speed, without resorting to new speed and development time tests. It looks to me like an exposure decrease of 1 stop would bring the 10-minute development line into the range of AA's target densities. Is this a sensible idea?

Any thoughts or suggestions about this approach?

cheers
Tom
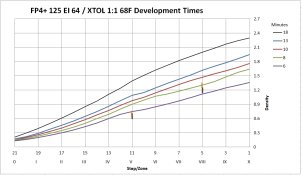
FP4_64_Development_Times.jpg
 

Sirius Glass

Subscriber
Joined
Jan 18, 2007
Messages
50,411
Location
Southern California
Format
Multi Format
Increasing development time does not raise the film speed, it raises the contrast only.
 

Bill Burk

Subscriber
Joined
Feb 9, 2010
Messages
9,326
Format
4x5 Format
C5D927CF-C6CE-454F-8460-2F32D944C2CD.jpeg

I eyeballed the numbers which makes my graph “unreliable” but wanted to see what’s up. You used a standard developer so I called rated speed 125 where ASA/ISO parameters are met (about 11 minutes).

Your interpretation mistake: You need to look at numbers “above filmbase plus fog” (Ansel Adams - The Negative pg. 220) which gets you in the 8-10 minutes for N range and makes everything look right.

I would call 10 minutes N and recommend ISO 125 for averaging/incident meter but EI 80 for field use of Spotmeter with Zone System readings and placement of shadow subject luminance values. That’s general advice and I found your 10 minutes gets you there. 16 minutes for N+1 EI 200 / ZS-EI 125. N-1 7 minutes and N-2 6 minutes. (EI 100 / ZS-EI 64).
 

Bill Burk

Subscriber
Joined
Feb 9, 2010
Messages
9,326
Format
4x5 Format
Increasing development time does not raise the film speed, it raises the contrast only.

Yes, that’s true.

It’s a bit of fallacy to think that film speed changes when the intersection of the curve at 0.1 above filmbase plus fog moves.

The numbers I offered follow that fallacy.

It’s easier to do it right: call the speed always EI 125 when you’re doing average or incident metering and if you are using spotmeter in the field as taught in Zone System use EI 80 . It’s the Delta-X criterion that best illustrates the real speed of a film doesn’t change much with changes in development time.

So you could choose 125 (or 80 for ZS) regardless of development time.
 
Last edited:

Bill Burk

Subscriber
Joined
Feb 9, 2010
Messages
9,326
Format
4x5 Format
Now I had to shift the film speed on my graph 1/2 stop. You can see where I cut and taped the scale.

You gave the film a half stop greater exposure than you said you did.

I drew the graph based on what you called Zone V.

The characteristic curve lines on the graph illustrates the true characteristics of the film.

Then based on the characteristics of the 10 minute curve that met the ASA/ISO parameters, I shifted the scale to line it up with -2.2 log meter candle seconds, because that’s how much exposure would make a 125 rated film reach 0.1 density above filmbase plus fog. The film is just going to do that so that’s where the scale calibrates to be.

This half-stop shift is worth exploring.

It is as if the patch of the Stouffer scale you called “Zone V” is one step away from the one you should have callen “Zone V”. You should have picked one step lighter (less density). Also the first step of a Stouffer scale is not clear. It has about 0.05 (a third stop) filmbase plus fog.

If that wasn’t it, all these things could factor in to the difference between “what you said you did” versus “what you got”: Shutter speed accuracy, meter accuracy, the nearness of what the meter advised to the shutter speed and f/stop picked (I keep 0.1 and 0.2 ND filters for camera based film speed testing so that I can match the meter reading to the camera settings more precisely). You might not have T-Stops on your lens (but that would factor “the other way”).
 
OP
OP

tom williams

Subscriber
Joined
Jan 24, 2020
Messages
282
Location
Arizona
Format
4x5 Format
Bill, thanks for catching my failure to account for FB+F, and for the rest of your analysis. I'm stewing on it.
 
OP
OP

tom williams

Subscriber
Joined
Jan 24, 2020
Messages
282
Location
Arizona
Format
4x5 Format
Now I had to shift the film speed on my graph 1/2 stop. You can see where I cut and taped the scale.

You gave the film a half stop greater exposure than you said you did.

I drew the graph based on what you called Zone V.

The characteristic curve lines on the graph illustrates the true characteristics of the film.

Then based on the characteristics of the 10 minute curve that met the ASA/ISO parameters, I shifted the scale to line it up with -2.2 log meter candle seconds, because that’s how much exposure would make a 125 rated film reach 0.1 density above filmbase plus fog. The film is just going to do that so that’s where the scale calibrates to be.

This half-stop shift is worth exploring.

It is as if the patch of the Stouffer scale you called “Zone V” is one step away from the one you should have callen “Zone V”. You should have picked one step lighter (less density). Also the first step of a Stouffer scale is not clear. It has about 0.05 (a third stop) filmbase plus fog.

If that wasn’t it, all these things could factor in to the difference between “what you said you did” versus “what you got”: Shutter speed accuracy, meter accuracy, the nearness of what the meter advised to the shutter speed and f/stop picked (I keep 0.1 and 0.2 ND filters for camera based film speed testing so that I can match the meter reading to the camera settings more precisely). You might not have T-Stops on your lens (but that would factor “the other way”).
Bill, I have a certain result sticking in my craw, that's inhibiting my confidence in my dexterity with the H and D charts. And it's this: twice I've followed the same procedure to determine film speed for FP4+, with results that seem at odds with published data.

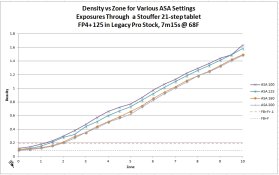
The procedure was to photograph a white field - in full sun - for a Zone X exposure, on four sheets of the same film, with ASA settings of 100, 125, 160 and 200. For each exposure, a Stouffer 4x5 Step Tablet overlay the negative. All the negatives were developed at the same time, identically. I used a Tobias densitometer to evaluate the step tablet image densities for each negative. The resulting H and D curves are attached.

The curves are ordered in a sense opposite from what I expected based on what I've read (Beyond The Zone System, 4th edition, Phil Davis, pg 53 for instance). But as I actually think about it, the left-to-right order of the curves drawn from my data makes sense to me : if I expose a sheet of film for a shorter period of time (higher ASA), all other things being equal, the step tablet densities should be smaller than those on a nominally identical sheet exposed for a longer time (lower ASA). Hence, curves representing increasing ASA for the same film should be arrayed with film speed increasing left to right. Davis' figure 4-16 on page 53 of the 4th edition shows speeds increasing in the opposite direction.

Likely, Davis' example is meant to illustrate determining speeds for 5 films of different speeds, but I didn't see that spelled out, and initially assumed that a single film stock was being tested at different speeds. Around the same time I saw a plot that ramified what I (mis-)understood about Davis' plots. Obviously, as a semi-muddled amateur, I'm not going to call out Mr Davis. So I'm looking for a bit of confirmation on my speed test results and my current interpretation of Mr Davis' plots. Can you comment?


FP4_Speed_plot.jpg
 

Bill Burk

Subscriber
Joined
Feb 9, 2010
Messages
9,326
Format
4x5 Format
I’ll dig the BTZS book out after the weekend.

You don’t need to make various exposures of the Stouffer scale except to find one nice exposure for that speed of film. Davis puts too much emphasis on getting the test exposure correct. Getting the test exposure consistent is the thing.

Shift the x-axis for each of the four curves here. The curve of the four sheets should superimpose exactly except at the ends where you have a little more or less showing.
 
OP
OP

tom williams

Subscriber
Joined
Jan 24, 2020
Messages
282
Location
Arizona
Format
4x5 Format
I’ll dig the BTZS book out after the weekend.

You don’t need to make various exposures of the Stouffer scale except to find one nice exposure for that speed of film. Davis puts too much emphasis on getting the test exposure correct. Getting the test exposure consistent is the thing.

Shift the x-axis for each of the four curves here. The curve of the four sheets should superimpose exactly except at the ends where you have a little more or less showing.

No rush here - and thanks for your input so far. I'm off on a road trip from Tuesday, for 1-2 weeks - taking note of your posts #5 and #6.
 
OP
OP

tom williams

Subscriber
Joined
Jan 24, 2020
Messages
282
Location
Arizona
Format
4x5 Format
An improved chart is attached. The ISO triangle is aligned to the 10m development curve.
FP4_dev_plot_corrected.jpg
 
OP
OP

tom williams

Subscriber
Joined
Jan 24, 2020
Messages
282
Location
Arizona
Format
4x5 Format
Just back from a road trip - might have to mortgage the house to pay for the gas.

About the shift in the development curve, I had just enough gumption after the trip to check into the possibility that there is a contribution from my light meter.
I tested my Sekonic L778 Dual Spot F against my Minolta Spot M, with both set to ASA 125. Both meters were in the 1-degree-field mode. I recorded the difference (Sekonic reading minus Minolta reading) in EV, of a few monolithic, homogeneous surfaces, on a bright sunny day: sunlit concrete slab (+0.6), shaded light siding (+0.8), sunlit dark siding (+0.8), shaded white door (+0.7), dark car-door fender (+0.6). The Sekoinic reads 0.6-0.8 EV higher than the Minolta, consistently. I used the Sekonic to take all the data shown in the plot I've shown in this thread.

An earlier round of tests, using the same film (FP4+), meter (Sekonic), and developer (XTOL 1:1 68 degrees), show the same ~1/2 stop shift in the curves. I tested TMax 100 recently and earlier as well, and I see a somewhat larger shift in the development curves.

It's obviously a relative test, with no objective reference. But suggestive. Too bad I don't have similar tests performed with the Minolta. I still have the Minolta, so a repeat test with it could be done, if I get to feeling self-abusive.
 

Bill Burk

Subscriber
Joined
Feb 9, 2010
Messages
9,326
Format
4x5 Format
Once you hit the ASA parameters the light meter is irrelevant. Fresh film characteristics are the one thing you can trust.

-2.2 log meter candle seconds is how much exposure will make a 125 rated film reach 0.1 density above filmbase plus fog.

You can try to evaluate any difference between where you expected that point to fall and where it actually falls. The answer to “which light meter better evaluates exposure” can be seen by which one came closer to predicting that point. But other things may factor in, so even if you form an opinion, you may be wrong in reality.
 

Bill Burk

Subscriber
Joined
Feb 9, 2010
Messages
9,326
Format
4x5 Format
doesn't it do a bit of both?

The 0.3 gradient speed doesn’t change much with changes in development.

This means the speed at which an excellent print can be made doesn’t change much with development.

But the push speed does change, for lack of a better word. You can use a higher exposure index if you push by developing for more time than normal.

So if you accept the 0.3 gradient is where the speed should be determined, you don’t need to apply schemes like the one laid out in BTZS; where you change your EI with each shot taken under different subject luminance ranges.
 

Sirius Glass

Subscriber
Joined
Jan 18, 2007
Messages
50,411
Location
Southern California
Format
Multi Format
doesn't it do a bit of both?

Not not really. XTOL is supposed to slightly raise the film speed, but not that I could detect without endless wasteful needless and useless exhaustive testing. I rather spend my time photographing.
 

ic-racer

Member
Joined
Feb 25, 2007
Messages
16,561
Location
USA
Format
Multi Format
I have never done in camera exposure index like described by OP.
I expose a uniform target in daylight, with lens focused at infinity to zone I and if it is 0.1 log d after processing, the EI used for the test is confirmed.
 

ic-racer

Member
Joined
Feb 25, 2007
Messages
16,561
Location
USA
Format
Multi Format
There are many different types of film sensitivity standards in the literature, but for B&W negative, the accepted standard is ISO Speed which can't change with changing development, because development conditions are fixed to a specific condition for the test.
 

Bill Burk

Subscriber
Joined
Feb 9, 2010
Messages
9,326
Format
4x5 Format
I have never done in camera exposure index like described by OP.
I expose a uniform target in daylight, with lens focused at infinity to zone I and if it is 0.1 log d after processing, the EI used for the test is confirmed.

You, who has all the sensitometers in the world (except maybe a Kodak Type 1B), shoots a plain target?
 
OP
OP

tom williams

Subscriber
Joined
Jan 24, 2020
Messages
282
Location
Arizona
Format
4x5 Format
I have never done in camera exposure index like described by OP.
I expose a uniform target in daylight, with lens focused at infinity to zone I and if it is 0.1 log d after processing, the EI used for the test is confirmed.
This sounds straightforward and far less painful than the method I pursued. But if it is not true that it is 0.1 log d after processing, you repeat the test at a new EI? Until the result is good? I don't doubt that experience and photographic nous minimize the number of trials.

Sirius Glass: Increasing development time does not raise the film speed, it raises the contrast only.
Let me mention here that my initial question (poorly posed, apparently) was not intended to be about changing the speed of shot film via development, but about using the results of 'standard' development to infer an improved speed for future shooting.

Bill Burke: You can try to evaluate any difference between where you expected that point to fall and where it actually falls. The answer to “which light meter better evaluates exposure” can be seen by which one came closer to predicting that point. But other things may factor in, so even if you form an opinion, you may be wrong in reality.

... but a fellow has to start somewhere, to optimize predictability. Shooting a test sheet at ASA 125 using the Sekonic, then the Minolta, and developing both sheets at 10m may tell me that the 1/2 stop shift is or is not attributable to a light meter calibration, yes?
 
OP
OP

tom williams

Subscriber
Joined
Jan 24, 2020
Messages
282
Location
Arizona
Format
4x5 Format
I have never done in camera exposure index like described by OP.
I expose a uniform target in daylight, with lens focused at infinity to zone I and if it is 0.1 log d after processing, the EI used for the test is confirmed.

Now that I think about it, I don't believe I know what you mean by "0.1 log d". Can you explain?
 
Joined
Jan 26, 2010
Messages
1,286
Location
South America
Format
Multi Format
Increasing development time does not raise the film speed, it raises the contrast only.

Sirius, that's wrong.
Not only middle gray value and optimal EI change with extended development: even shadows do, in a small amount.
You can see it yourself the day you decide to do that homework.
Speed depends also on the developer.
 
Joined
Jan 26, 2010
Messages
1,286
Location
South America
Format
Multi Format
Even more: you can make a film faster by extending development, and, without getting more contrast...
That's when agitation becomes relevant.
 

MattKing

Moderator
Moderator
Joined
Apr 24, 2005
Messages
53,232
Location
Delta, BC Canada
Format
Medium Format
Juan,
Extending development does not increase film speed (aka sensitivity to light) appreciably.
It does alter the characteristic curve though, which can result in more usable results from exposure that is less than optimum.
 
Photrio.com contains affiliate links to products. We may receive a commission for purchases made through these links.
To read our full affiliate disclosure statement please click Here.

PHOTRIO PARTNERS EQUALLY FUNDING OUR COMMUNITY:


Ilford ADOX Freestyle Photographic Stearman Press Weldon Color Lab Blue Moon Camera & Machine
Top Bottom