Film curve plotting and fitting

Girraween

A
Girraween

  • 0
  • 0
  • 67
mirrorculous

A
mirrorculous

  • 3
  • 0
  • 638
The Lady In Black

A
The Lady In Black

  • 1
  • 0
  • 839
Lady in Black

A
Lady in Black

  • 6
  • 0
  • 911

Forum statistics

Threads
199,875
Messages
2,798,023
Members
100,065
Latest member
surf2trails
Recent bookmarks
0

Photo Engineer

Subscriber
Joined
Apr 19, 2005
Messages
29,018
Location
Rochester, NY
Format
Multi Format
Does that filtration effectivly remove the unnatural xenon spikes too?
Are there situations where you would not bother with correcting the light?

Ray

Ray;

Our units at EK used special "tungsten" lamps with no spikes. They had a continuous spectral output that could be used at any color temperature from about 3000K to 5500K.

The EG&G units, AFAIK, were just as acceptable as any other strobe lighting system. If you accept strobe, then you will automatically accept the EG&G unit as being usable.

PE
 

Photo Engineer

Subscriber
Joined
Apr 19, 2005
Messages
29,018
Location
Rochester, NY
Format
Multi Format
One overexposes to move off of the toe of the curve onto the straight line. Using one's "usual development" one ends up with greater contrast and more separation in the shadows.

Ed;

If you are exposing on the toe and move up to the straight line portion of the curve then you will see a contrast increase, but if you are developing properly, then that increase will be "proper". After all, if the mid scale is about 0.6 - 0.65, then the mid scale is correct and you were just seeing low contrast due to the use of the toe!

However, if you are exposing properly and developing properly, then the ISO assigned to a given film should keep you off the toe. If it does not, an overexposure of up to 1/3 stop does not affect contrast at the same development time, it merely improves shadow detail.

PE
 

Photo Engineer

Subscriber
Joined
Apr 19, 2005
Messages
29,018
Location
Rochester, NY
Format
Multi Format
I use a Wratten 80A color temp conversion filter on my enlarger to get close to daylight. I've checked it with a late-1980s vintage Minolta Color Meter and it brings the temp to 5400K, I think.

An 80B or 80C would drop the temp closer to 4600K, but since I'm testing film and not the meter, I figure being closer to 5500K was better.

Kirk;

Any of these will work.

PE
 

Mahler_one

Member
Joined
Oct 26, 2002
Messages
1,155
Have it...fine. Most of the time my negatives are indeed exposed and developed "properly". Thanks again.

Ed
 
Joined
Jan 7, 2005
Messages
2,663
Location
Los Angeles
Format
4x5 Format
And to add to my question about about the 'first excellent print' study. I doubt they adjusted film development times, something I certainly would be doing (less time) when the overexposure was most severe (long range subject).
Bill

I don't think they specifically did for the very reason they hadn't defined it yet. They did do a whole range of processing and exposures with each image. So, they effectively should have covered most conditions. Great, now I have to go back and re-read the paper.
 
Last edited by a moderator:

RalphLambrecht

Subscriber
Joined
Sep 19, 2003
Messages
14,706
Location
K,Germany
Format
Medium Format
With my Durst L1200 and 250W halogen bulb, I get 5500 K (daylight) with 82C and 82M filtration. However, there is not much light energy left after this filtration, because the halogen bulb only has a very limited blue content. It's, unfortunately, not enough to test film at reasonable exposure times. On the other hand, I can simulate 2180 K (tungsten) with 69Y or a Y8 filter and are left with plenty of light.
 
Joined
Jan 7, 2005
Messages
2,663
Location
Los Angeles
Format
4x5 Format
I found a few quotes that might have some relevance. The very existence of this paper also suggests a continuing use of pictorial tests to confirm the practicality of speeds. It's from Grover,W.S. and Grimes, R.L., Improved Method for Determining the Speeds of Photographic Films by Pictorial Tests, Photographic Science and Engineering v. 11, n. 4, July-August 1967.

The paper is mostly about testing with color reversal but the basic principles are the same for b&W.

"It is their aim, in each instance, to find a sensitometric criterion that will be reasonably simple to operate, give good reproducibility, and yield sensitmetric speeds that correlate satisfactorily with the effective speeds of the film in normal picture taking practice."

"Films differing in D-log E curve shape were required for this study because almost any speed criterion is successful if the D-log E curve shape remains constant."

"Experience has shown that in picture test for speed derivation, there are six basic factors which must be controlled or chosen, namely:
1. Camera shutter and aperture calibration.
2. Subject composition and lighting geometry.
3. Solar altitude or sun angle.
4. Projection conditions.
5. Method of presentation of slides and judging techniques.
6. Conversion of exposure data to speeds."

"The judges are asked to ignore quality attributes that are not directly associated with exposure. These include color balance, model pose, composition, etc. However, every effort should be made to eliminate such undesirable variables from the sample."
 
Last edited by a moderator:

ic-racer

Member
Joined
Feb 25, 2007
Messages
16,633
Location
USA
Format
Multi Format
Any value for X. It is actually Log E, but you can just use 1, 2, 3 etc, for the step numbers on the wedge.

PE
Ok, so if I am understanding, the crux of it is that you zero in on an exposure that is not OVER or UNDER, right?

Reminds me of my "bullseye" model which I set exposure based on a midpoint between the shoulder and the toe to evenly distribute the films exposure latitude around the center (ie bullseye):
Bullseye.jpg

Min.jpg
 

ic-racer

Member
Joined
Feb 25, 2007
Messages
16,633
Location
USA
Format
Multi Format
The above is a little 'tongue-in-cheek' because its not easy with the usual sensitometer and 21 step wedge to find a '0.2 below maximum' on the shoulder to get an exact middle point.

In a nutshell for practical use it amounts to adding 2 stops of exposure to 'box speed' with a high latitude film like T-max film .
 

Photo Engineer

Subscriber
Joined
Apr 19, 2005
Messages
29,018
Location
Rochester, NY
Format
Multi Format
Well, the results are a bit off from what I suggest. With a normal 0.6 - 0.65 contrast negative film, the entire scene would pretty much fit in the straight line portion of the negative film curve. I am not going to translate your X axis into my units, but that curve looks like a paper curve. If it is to be the curve of the print, you should plot Dmax on the left to follow convention.

All negative curves have Dmax on the right and all print or positive curves have Dmax on the left to follow the Log E representation of the X axis.

Given that it is a print curve, the print is exposed too far into the toe, and not enough in the shoulder. And, if it is a print curve or a reversed scan of a negative, I cannot say where you are!

PE
 

ic-racer

Member
Joined
Feb 25, 2007
Messages
16,633
Location
USA
Format
Multi Format
, but that curve looks like a paper curve.

The diagram doesn't represent a real film curve, its just a diagram to show the concept. I don't have a good way to make a 'complete' film curve that goes from film base to d-max to show a 'real' curve with the total shoulder.

But in practice it would be similar to putting it all on the straight portion. Its just that this model was conceived as a way to minimize errors in exposure.

A good example of this technique is to use a classic rangefinder with no meter and use T-max 400. I then use the 'film insert exposure guide' for ISO 100 film and guess all the exposures.

In fact on a recent trip I took my Rolliecord with ISO 400 film. I use the guide printed right on the back of the camera (for ASA 100). It really works well.
 

BetterSense

Member
Joined
Aug 16, 2008
Messages
3,151
Location
North Caroli
Format
35mm
Agreed; that's basically my technique. Use an incident meter (or swag) and expose "generously". Plenty of shadow detail is assured and it couldn't be any easier. I marvel at people using spot meters and testing their film speeds to a supposed 1/3 stop. I don't think I have a shutter that is within 1/3 stop anywhere in my kit.
 

Photo Engineer

Subscriber
Joined
Apr 19, 2005
Messages
29,018
Location
Rochester, NY
Format
Multi Format
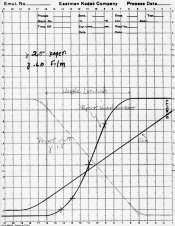
Film and paper curves

Here are some quick and dirty negative film and paper curves that you should take a look at.

They are typical of what we worked with and in fact are drawn on some sheets of graph paper that I had here in a file cabinet. I hope they help you out.

PE
 

Attachments

  • film-paper-print curves.jpg
    film-paper-print curves.jpg
    157.2 KB · Views: 160

Ray Rogers

Member
Joined
Aug 27, 2005
Messages
1,543
Location
Earth
Format
Multi Format
Here are some quick and dirty negative film and paper curves that you should take a look at.

They are typical of what we worked with and in fact are drawn on some sheets of graph paper that I had here in a file cabinet. I hope they help you out.

PE

Just out of curiosity, could you show the rest of the film curve... ?
This curve, like (ic racer's) doesn't represent a real film curve,
but is just a diagram to show the concepts... correct?

Ray
 

Photo Engineer

Subscriber
Joined
Apr 19, 2005
Messages
29,018
Location
Rochester, NY
Format
Multi Format
The film curve continues onward at a slope equal to the one shown until it reaches D=3.0 and then shoulders off. It and the paper curve represent current modern negative film aims. The paper curve represents a modern paper aim with the points marked being the specific measurement points for release. The print curve in the plot is the only "calculated" curve, having been derived from the two negative curves.

PE
 

ic-racer

Member
Joined
Feb 25, 2007
Messages
16,633
Location
USA
Format
Multi Format
Given that it is a print curve, the print is exposed too far into the toe, and not enough in the shoulder. And, if it is a print curve or a reversed scan of a negative, I cannot say where you are!

PE

I re-read your post, just for clarification, in the diagram, the barn is not a "Print," but a "Scene," or, the image at the film plane. The values on the barn are not print values but scene values and the little zone wedge represents the input values to the curve on the x-axis. The lines to values on the barn are what you might aim at with a spot meter.

The curve represents a standard HD curve that goes all the way out to show the shoulder and D-max on the right.
 

Photo Engineer

Subscriber
Joined
Apr 19, 2005
Messages
29,018
Location
Rochester, NY
Format
Multi Format
I re-read your post, just for clarification, in the diagram, the barn is not a "Print," but a "Scene," or, the image at the film plane. The values on the barn are not print values but scene values and the little zone wedge represents the input values to the curve on the x-axis. The lines to values on the barn are what you might aim at with a spot meter.

The scene was somehow represented in that picture, and that is what I cannot follow. Sorry. I'll take another look. However, optical density does not relate to log E in a scene, only in a print or negative.

PE
 

ic-racer

Member
Joined
Feb 25, 2007
Messages
16,633
Location
USA
Format
Multi Format
Just for clarification on another personal concept. I treat film as a recording device. In a manner similar to sound recording (which I also do). When you record a sound, you fit it to the bandwidth of the recording medium and the final intensity is set at mixdown time.

Likewise when 'recording' a visual scene with film, I want to capture all the tonal information in the scene (and will try to expose as such). Later, at my leisure in the darkroom, I'll pick-and-choose how much highlight and shadow I want to throw out (if any) at the time of printing.

Another CONCEPT I hold (that may or may not be true) is that I feel in my hands ANY contrast range of values actually recorded on the film (ie any or all values between the toe and shoulder) can be printed when one considers the range of techniques from flashing 00 paper and low contrast paper developer to high-contrast lith techniques.
 

ic-racer

Member
Joined
Feb 25, 2007
Messages
16,633
Location
USA
Format
Multi Format
The scene was somehow represented in that picture, and that is what I cannot follow. Sorry. I'll take another look. However, optical density does not relate to log E in a scene, only in a print or negative.

PE

On the Y-axis label, should be in the units one would read off the transmission densitometer so "Density" but not "Optical Density" right?
 

tlitody

Member
Joined
Apr 29, 2010
Messages
186
Format
35mm
Just for clarification on another personal concept. I treat film as a recording device. In a manner similar to sound recording (which I also do). When you record a sound, you fit it to the bandwidth of the recording medium and the final intensity is set at mixdown time.

Likewise when 'recording' a visual scene with film, I want to capture all the tonal information in the scene (and will try to expose as such). Later, at my leisure in the darkroom, I'll pick-and-choose how much highlight and shadow I want to throw out (if any) at the time of printing.

Another CONCEPT I hold (that may or may not be true) is that I feel in my hands ANY contrast range of values actually recorded on the film (ie any or all values between the toe and shoulder) can be printed when one considers the range of techniques from flashing 00 paper and low contrast paper developer to high-contrast lith techniques.

Let me ask you a question. If you have a scene which is 15 stops of brightness range, do you think you can reproduce all the tones in that scene in a print?
 

Bill Burk

Subscriber
Joined
Feb 9, 2010
Messages
9,383
Format
4x5 Format
Stephen,
The idea that any method is successful when the curve is straight is important. Your six variables are also important. In my practice, my curve is straight. Also in my practice most of these variables are out of my control. For example when backpacking, if I find a scene I want to capture, I have to take the picture at the moment because I am moving on and won't be back, possibly for several years if ever. I'm stuck with whatever time of day or sky conditions are there. If I can talk my buddy into camping near that spot I have a chance for afternoon light and if I am lucky there will be weather.

IC-Racer,
Your broad side of a barn illustration is an awesome illustration concept for this thread! It doesn't look like the barns changed to illustrate the compression of tones in the toe. It also looks like you made a caricature of the speed point. It almost looks as if you placed Zone V on 0.3Gradient. In practice that point is a shadow reference (place Zone I or II) and you move up a few stops (do what the meter says) (place Zone V). I think you knew all that but again awesome diagram.

PE,
Your film and paper graph looks a lot more like what I would expect. The curve looks very much like my results with TMY-2. I'll have to learn the trick of corresponding print to paper but I suppose the math is simple subtraction.

tlitody,
For my graph of TMY-2 in D-76 1:1, I used Stephen's 21-step sensitometer and added a 2-stop ND filter giving me 25 steps (12 1/2 stops) data. My graph is more like PE's where the straight line starts early and extends to the end. But a 15-stop brightness range would require me to select 4 or 5 minutes development time. Development is uneven at those development times, my two graphs are nearly identical and cross each other at points. I can see mottling and different density readings from the same step vary more than they should. Conclusion. No, you can't put 15 stops (30 steps) on TMY-2 and D-76 and expect to make a fine print. You could capture and reproduce the tones, but the print would be ugly. But if you want to experiment with Pyrocat, that developer is proven to handle extreme subject brightness ranges.

Bill
 

tlitody

Member
Joined
Apr 29, 2010
Messages
186
Format
35mm
tlitody,
You could capture and reproduce the tones, but the print would be ugly.
Bill

That is exactly my point. Theory of what you can capture in the neg is all well good but in the real world, it is what sort of a print you can make from it which counts.

I have repeatedly said that black and white photographers get hung up on what is theoretically doable as far as the negative is concerned but they should move on from that and learn what is the optimum subject contrast range for the materials they are using and be selective about their subjects if they want to produce really good prints with a high sucess rate.
 

Photo Engineer

Subscriber
Joined
Apr 19, 2005
Messages
29,018
Location
Rochester, NY
Format
Multi Format
Bill;

The film and paper to print is multiplication of the slopes as I gave in detail in an earlier post.

IC;

Film is sensitive to Brightness as a function of Log Exposure, but is plotted as Density obtained from the image as a function of exposure. So, we think of a scene which yields different brightness levels which exposes the film at different values of Log E which then is turned into Density which can be plotted against Log E. The D vs Log E is nominally a curve with a long mid scale at a constant gradient of 0.6 - 0.63. The length of this scale can be adjusted but through experience usually runs from about 0.3 to 3.0 in density and can thus capture most scenes. In my example, this range covers about 13 stops. Normally, this covers most scenes and allows for over and under exposure.

PE
 

ic-racer

Member
Joined
Feb 25, 2007
Messages
16,633
Location
USA
Format
Multi Format
Let me ask you a question. If you have a scene which is 15 stops of brightness range, do you think you can reproduce all the tones in that scene in a print?

If the film has 15 stops between toe and shoulder, there is no issue. But with flare, in real life, there will be less than 15 on the film, making the task even easier. The separation between the values will be small , so overall the 'straight print' will look 'flat' or without enough 'contrast' to many viewers as pointed out.

The utility of making a straight print to show all the values on the negative (for me) is to 'see' what is on the negative in a proof-print, or a first print (ie use a 00 filter etc). A similar (maybe better) proofing technique would be to use a higher contrast paper and bracket some print exposures of the whole scene to see the whole tonal scale of a negative like this and proceed from there.

Another technique Bob Carine has mentioned is to watch the values come up during development in the developer tray. Areas that will wind up totaly black in the fully developed print may go through a stage where you can see detail in there, alerting you to dodge those areas in the next print (if you want that detail). I call it the "ontogeny recapitulates phylogeny" technique :smile:
 
Last edited by a moderator:
Photrio.com contains affiliate links to products. We may receive a commission for purchases made through these links.
To read our full affiliate disclosure statement please click Here.

PHOTRIO PARTNERS EQUALLY FUNDING OUR COMMUNITY:


Ilford ADOX Freestyle Photographic Stearman Press Weldon Color Lab Blue Moon Camera & Machine
Top Bottom