Film curve plotting and fitting

Girraween

A
Girraween

  • 0
  • 0
  • 14
mirrorculous

A
mirrorculous

  • 2
  • 0
  • 589
The Lady In Black

A
The Lady In Black

  • 0
  • 0
  • 788
Lady in Black

A
Lady in Black

  • 6
  • 0
  • 861

Forum statistics

Threads
199,874
Messages
2,797,987
Members
100,064
Latest member
RonnieP
Recent bookmarks
1

Photo Engineer

Subscriber
Joined
Apr 19, 2005
Messages
29,018
Location
Rochester, NY
Format
Multi Format
Well, actually, the best fit cubic spline drawn through the data points with the data points all shown is what we used. As for interpretation, we had "aim" curves on transparent overlays with up to 7 points marked for use in interpretation for judging a coating and for the design of the next experiment. This included Dmax, Dmin, shoulder, high toe, low toe, speed and contrast. Some were absolutes, some had limits. For example, dmax was measured by lower limit. It could go higher without problems as long as everything else was good.

PE
 

ic-racer

Member
Joined
Feb 25, 2007
Messages
16,633
Location
USA
Format
Multi Format
I'm curious as to what the benefit of curve fitting is over a straight x,y raw data plot. It seem to me, like a lot of talk and effort to draw a pretty curve with little talk about interpreting the results.

(there was a url link here which no longer exists)
 

Nicholas Lindan

Advertiser
Advertiser
Joined
Sep 2, 2006
Messages
4,277
Location
Cleveland, Ohio
Format
Multi Format
Maybe you would prefer having lunch at George Eastman house with a table full of real experts!

What's the fun in that? For anyone.

"Those who think they know it all really annoy those who do." anon
 
Last edited by a moderator:
OP
OP

dpgoldenberg

Member
Joined
Feb 18, 2009
Messages
50
Format
Med. Format RF
A curve for everyone!

OK, here is a single fitting function that will work for the toe, linear region and shoulder, and properly approaches asymptotes at both the low and high ranges. The function is:

f(x) = a1*log(1+exp(a2*x+a3))/(a4+log(1+exp(a2*x+a3)))

This is based on my original function for the toe and linear regions, but then modifies the result of that function by a rectangular hyperbolic function to form the shoulder at the larger values.

Here is a fit to Ralph's paper data.

David
 

Attachments

  • paperFit.png
    paperFit.png
    15.5 KB · Views: 94
Joined
Jan 7, 2005
Messages
2,663
Location
Los Angeles
Format
4x5 Format
I was going through Fundamentals of Photographic Theory 2nd edtion since I went to the trouble of pulling it out. In chapter 11, Interpretation of Sensitometric Data under The Determination of Sensitivity on page 210, it reads, "this adoption of inertia speed was based upon the assumption that, for the correct reproduction of tones in the final positive, the scale of luminance in the object must be represented by exposures on the straight line portion of the characteristic curve of the negative. It has been shown recently that this assumption is unwarranted." It also said that because of emulsions and developers at the time of H&D, inertia speeds were independent of processing.
 

Photo Engineer

Subscriber
Joined
Apr 19, 2005
Messages
29,018
Location
Rochester, NY
Format
Multi Format
I was going through Fundamentals of Photographic Theory 2nd edtion since I went to the trouble of pulling it out. In chapter 11, Interpretation of Sensitometric Data under The Determination of Sensitivity on page 210, it reads, "this adoption of inertia speed was based upon the assumption that, for the correct reproduction of tones in the final positive, the scale of luminance in the object must be represented by exposures on the straight line portion of the characteristic curve of the negative. It has been shown recently that this assumption is unwarranted." It also said that because of emulsions and developers at the time of H&D, inertia speeds were independent of processing.

And yet other data disagrees. Did they offer any proof?

PE
 

Nicholas Lindan

Advertiser
Advertiser
Joined
Sep 2, 2006
Messages
4,277
Location
Cleveland, Ohio
Format
Multi Format
It also said that because of emulsions and developers at the time of H&D, inertia speeds were independent of processing.

There is still some truth to that. Changing the processing doesn't change the film speed, only the contrast. 'Pushing' works because it takes the image that is exposed down on the toe of the curve, where there is very little contrast, and increases it so the negative can be printed on normal paper. I have often had to print severely underexposed pictures - hand held by candlelight - that were on an unpushed roll. The pictures required Brovira 6 to print and looked like they had the piss pushed out of them even though they had normal development.
 
Joined
Jan 7, 2005
Messages
2,663
Location
Los Angeles
Format
4x5 Format
And yet other data disagrees. Did they offer any proof?
PE

Sorry, I was just having some fun and making a point about absolutes. Look at the quote again. It says "for the correct reproduction" it must fall on the straight line. It's just too much of an extreme assumption because it isn't the necessary in order to have a good reproduction. I mean what is correct? There is always tonal compression on both ends of the tone reproduction curve. There isn't or should there be a tone for tone reproduction between the original subject and the reproduction.

Nicolas,

Changing processing does change the film speed. If you use fractional gradient or Delta-X, the suggested accurate method for processing other than normal, it doesn't move much. That's why the 0.3G ASA didn't specify a gradient other than a minimum. For the record, fixed density doesn't produce accurate speeds beyond the ISO contrast parameters.

I included that statement about speeds being independent of development with the inertia method to have an example of the importance of the method for determining film speed. Because of the way the curve was and how inertia drew a line from the bottom of the straight line to the X-axis, it tended to fall on the same spot regardless of the contrast.

According to Fundamentals, the Inertia method could vary as much as 500% with increasing gradient which was one of the reasons it was unani9ously rejected by the Ninth Internation Congress of Photography in 1935.
 
Last edited by a moderator:

Photo Engineer

Subscriber
Joined
Apr 19, 2005
Messages
29,018
Location
Rochester, NY
Format
Multi Format
Steven;

Yes, I agree on all counts. That curve from Mees that I posted shows 3 distinct areas. One is an acceptable print and everyone agreed, another is what some people called acceptable and others called excellent. The third region, on the straight line, is where everyone agreed again and called the prints excellent.

And yes, the speed does change with processing as does contrast. If you have an opportunity to play with coatings, you will find that speed also varies with the amount of silver coated as do sharpness and grain. There are many knobs to turn when designing photo materials.

PE
 

RalphLambrecht

Subscriber
Joined
Sep 19, 2003
Messages
14,706
Location
K,Germany
Format
Medium Format
OK, here is a single fitting function that will work for the toe, linear region and shoulder, and properly approaches asymptotes at both the low and high ranges. The function is:

f(x) = a1*log(1+exp(a2*x+a3))/(a4+log(1+exp(a2*x+a3)))

This is based on my original function for the toe and linear regions, but then modifies the result of that function by a rectangular hyperbolic function to form the shoulder at the larger values.

Here is a fit to Ralph's paper data.

David

Dave

I think you're on to something here. I tried this function with some of my film data, and it works great with all the ones I tried! It also works for papers but not very well beyond grade 3. There seems to be an issue with harder grades. See the attached file and the huge negative value for a4!

If you can read Deltagraph files, I can send you some data to fine-tune your function?
 

Attachments

  • Dave.jpg
    Dave.jpg
    132.6 KB · Views: 106

RalphLambrecht

Subscriber
Joined
Sep 19, 2003
Messages
14,706
Location
K,Germany
Format
Medium Format
... Changing the processing doesn't change the film speed, only the contrast. ...

Nicholas

Sorry, not trying to be difficult or against whatever you say, but this is really not my experience at all. Film speed definitely changes with processing. Every family of characteristic curves illustrates this fact.
 

ic-racer

Member
Joined
Feb 25, 2007
Messages
16,633
Location
USA
Format
Multi Format
So, speed relates to picture quality.
Development relates to scene density range
For each scene, there is a minimum exposure that gives the best print
For each scene there is only a single development that gives best print

As the scene has less and less overall density range, the development increases to get the best print. The speed seems to increase, but part (or all) of that effect is because the overall scene luminance range is less!

However, if you are printing with multigrade paper, you still get that SPEED ADVANTAGE of the low luminance range scene without altering the development.

Just my way of looking at it depending on how I defined speed above. :smile:

(if that is hard to follow it is my case for independence of speed and development)
 
OP
OP

dpgoldenberg

Member
Joined
Feb 18, 2009
Messages
50
Format
Med. Format RF
Ralph,
I'd be happy to look at some more data. But, something you can try is to add some fake points at the high density end of your data. Make a guess as to what D-max is and add some points with this value and large log(exp) values for x. Part of the problem here is, I think, that there isn't quite enough data to define the roll-over of the curve. You can also try fixing the value of a1 to your estimate of d-max.

David
 

Photo Engineer

Subscriber
Joined
Apr 19, 2005
Messages
29,018
Location
Rochester, NY
Format
Multi Format
Lookout....30 more pages of discussion on the way...:D

Look at the published Kodak chart on developers which influence Speed, Grain and Sharpness. With any one film, you can maximize two of these three characteristics of film while the other gets worse or stays unchanged.

PE
 

RalphLambrecht

Subscriber
Joined
Sep 19, 2003
Messages
14,706
Location
K,Germany
Format
Medium Format
Ralph,
I'd be happy to look at some more data. But, something you can try is to add some fake points at the high density end of your data. Make a guess as to what D-max is and add some points with this value and large log(exp) values for x. Part of the problem here is, I think, that there isn't quite enough data to define the roll-over of the curve. You can also try fixing the value of a1 to your estimate of d-max.

David

David

I don't have to guess on Dmax; it's pretty fixed. Maybe, rather than adding fake points, we can turn 'a1' from a variable to a constant and set it to, let's say, a value of 2.1? That said, what is the function of the other variables?
 
OP
OP

dpgoldenberg

Member
Joined
Feb 18, 2009
Messages
50
Format
Med. Format RF
David

I don't have to guess on Dmax; it's pretty fixed. Maybe, rather than adding fake points, we can turn 'a1' from a variable to a constant and set it to, let's say, a value of 2.1? That said, what is the function of the other variables?

When I said to "set" a1 to Dmax, that's what I meant; fix it so that it doesn't float in the fit. I'm not sure which approach will work better. Fake points will allow more flexibility in the fit, which could be good.

The other parameters in the function aren't so easy to map to the description of the curve, and I haven't had a chance to analyze it much. As in my original function, a2 and a3 define the position and width of the toe region. a4 determines where the curve starts to form the shoulder. The larger the value of a4, the later the shoulder. The slope of the (almost) linear region will be determined by a2, a3 and a4, but I haven't found a simple relationship yet.

David
 

Photo Engineer

Subscriber
Joined
Apr 19, 2005
Messages
29,018
Location
Rochester, NY
Format
Multi Format
Here is an actual aim curve for a 2.0 graded paper (I think it was similar to Kodabromide). It was also used for Ektacolor paper.

The exposure was to be 3800K, 1B filter, HA glass, 50R at 10" which should give this neutral.

PE
 

Attachments

  • Ektacolor 70 aim.jpg
    Ektacolor 70 aim.jpg
    300.5 KB · Views: 150
Joined
Jan 7, 2005
Messages
2,663
Location
Los Angeles
Format
4x5 Format
Just a couple of thoughts about exposure. When it comes to the perception of quality, we can all agree that there aren’t any absolute hard and fast boundaries. Part of what is considered quality depends on intended use. Large format landscape photographers usually require higher standards of quality, but there is an entire field of photography that routinely over rates the film and uses “push processing.” There are many extraordinary examples of photojournalism that would have been exposed at what is considered “just acceptable” which falls under the 0.3G point.

One thing we need to remember is that the 0.3G point is not the minimum gradient which will produce an excellent print. It is the minimum shadow gradient based on the overall average contrast. A scene with a long luminance range requires reduced development in order to print on a normal grade of paper, but as long as the shadow is above a gradient of 0.3x the average, the print will still be considered excellent. That means as the overall gradient changes, there is a shift in the viewer’s perception of quality as it relates to the requirements of the shadows. An acceptable shadow gradient for a long luminance ranged subject would look flat for a normal range.

Just because it is the minimum gradient for a given degree of processing, doesn’t mean that it is the aim gradient for the exposure or that it shouldn't be increased. Studies show that quality is maintained with additional exposure beyond 0.3G which consequently produce higher shadow gradients. The amount of additional exposure as it relates to quality is mostly limited by the degree of intended enlargement as grain and sharpness will then become factors.

As Ron points out, modern films have a very long straight-line portion and very little toe. His recommended +1/3 stop exposure or Ralph’s +1/2 stop exposure will place the exposure on or mostly on the straight-line portion. This will give the maximum possible shadow separation for that emulsion. Additional exposure beyond placing the shadow at the beginning of the straight-line portion is unnecessary as it wouldn’t produce any additional increase in the shadow gradient.

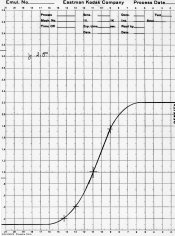
However, long toe films are still being made and as we can see from the example Ron posted earlier (which I consider to have a long toe), the required additional exposure necessary to place the shadows on the straight-line portion (point A in the example) is considerably more than what would be required for a short toe film. Any equal amount of exposure would yield different and therefore inconsistent levels of improvement in the shadow gradient depending on the film type used. In Ron’s posted example, the required exposure to place the shadows on point A would be around three stops higher than the 0.3G speed point and around two stops higher than the current ISO speed. It would be necessary for the long toe film having the same ISO speed and same CI as a short toe film to have an effective two stop lower EI in order to place the shadows on the straight-line portion and produce an equal amount of shadow separation as the short toe film’s straight-line portion.

I’m thinking that since long toe films are still being made in a time when the technology makes possible for very short toe films, there has to be a reason. Why buy a long toe film just to have to give it substantially more exposure in order to move the exposure off the toe? Maybe long toe films aren’t as strictly subject to the concept of placing all the exposure on the straight-line portion of the curve?

The perception of quality is relative after all. The eye tends to compress the lower values anyway. You only need to look at an equally spaced gray scale to confirm it. Munsell’s scale has equally visually spaced steps. There is greater separation in the shadows in order to make it look equally spaced. Now this is a good argument for using the maximum gradient possible. I agree, but it can also suggest that as we are used to seeing flatter shadow detail in nature it will accept it in a print to a degree. As a side note I contend that only with comparisons of the same scene shot with a long toe and short toe film will a person be able to see the differences produced by the curve shape. Generally the subject matter and the fact that our perception is relative will tend to obscure any tonal reproduction differences based on curve shape. It’s like relative pitch.

It is probably safe to assume that there is unanimous agreement here that good shadow contrast is critical in producing an optimum looking reproduction. There will, of course, be disagreements as to the degree. As gradient is the key factor in the perception of quality, we must then conclude a fundamental problem exists with any system of speed / exposure determination that uses a point of density without taking into account the surrounding local gradient. The Zone System is an obvious example of only using a fixed density point. Without taking the local gradient into account, simply applying a fixed amount of exposure or additional exposure above any standardized speed rating will produce less than consistent results depending on the shape of the film curve. This isn’t important if a photographer limits themselves to a single film type, but becomes more of a concern with multiple film types or if it is applied as a systematic rule to all film types.
 

Photo Engineer

Subscriber
Joined
Apr 19, 2005
Messages
29,018
Location
Rochester, NY
Format
Multi Format
Steven;

Very cogent comments on this subject. I can only say that you get what your film can give you. Ilford, Kodak and Fuji supply "modern" films and others supply some variety of earlier films from a variety of eras. These are not bad, just different and must be used as they are intended.

That said, I would also like to add into your comments the contribution of flare. Cheap lenses have lots of flare compared to the best of modern lenses. So this impacts on the curves I have shown as I commented earlier.

PE
 
Photrio.com contains affiliate links to products. We may receive a commission for purchases made through these links.
To read our full affiliate disclosure statement please click Here.

PHOTRIO PARTNERS EQUALLY FUNDING OUR COMMUNITY:


Ilford ADOX Freestyle Photographic Stearman Press Weldon Color Lab Blue Moon Camera & Machine
Top Bottom