Alan Edward Klein
Member
Where would I find the Dynamic Range of film in stops?:
1. Chromes?
2. Negative color?
3. B/W negative?
1. Chromes?
2. Negative color?
3. B/W negative?


Doesn’t the characteristic curve give you that info? If the x-axis is log base 2, every unit represents a doubling of exposure, ie one stop.
I don't know how to read them. How do I convert the curve into stops before clipping occurs and either end?

Here is a simple example of how to derive Zone System information from the characteristic curve. You can think of the zones as spanning the useful range of tones. For example, a "normal" seven-stop luminance range, with Kodak Tri-X, will give you Zones II-VIII, without "clipping" if you develop for around seven minutes at 20C in a rotary tube. There's a lot more to it, but this plot gives you the essence of extracting zones from the characteristic curve to estimate the useful range of tones, without going into the more complex tone reproduction analysis.
View attachment 325461
This appears to be a home-calculated chart. Can I use the charts provided by the film manufacturers on their film specification sheets?
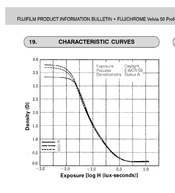
Here's the product information bulletin for Velvia 50. See page 8 for curves. How would I interpret them to figure stops of dynamic range?
"Dynamic Range" and "clipping" are the wrong terms but I get what you're asking for.
The characteristic curve on the Velvia (fig. 19 on page 8) and assuming that the units on the horizontal axis are Log10 , it looks like the useful exposure range of velvia is around five stops.
This is the range along the horizontal axis (the exposure axis) over which the curve is approximately a straight line.

@Alan Edward Klein , five stops is a very rough, eye-ball approximation.
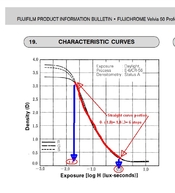
I'm not sure whether you are you challenging the estimate or if you are asking how did I come up with that estimate. Here's how to estimate the useful exposure range...
The useful range of exposures is that range of exposures which correspond to the straight line portion of the H-D curve. So estimating the useful range of exposure is a simple matter of deciding what section of the curve is roughly a straight line and then looking at the horizontal axis to figure the extent, or range of that straight line part.
I guess the 'trick' is to understand that the horizontal axis is log10H - So, a change of 0.3 along the horizontal axis represents doubling exposure, aka, one stop.
In the example given, the straight line part looks to me to roughly extend from 0.0 to a little past -1.5 - which is a range of roughly 1.5 and dividing 1.5 by 0.3, I get five stops...as a rough and conservative approximation. It might actually be closer six stops (from 0.0 to -1.8) .
A typical characteristic curve won't show the entire range, because they are usually made with a 21 step wedge with 1/2 stops between the steps. Modern B&W films (1980s on) will exceed that. Also, the dense area that is missing (shoulder) would be the clear area of the step wedge, and the sensitometer only will give out a limited amount of light, so the sensitometer intensity would need to be increased to see the shoulder.
Say for example T-max 400, which might have 14 stops, I'd have to increase the sensitometer exposure by 32 times (4 stops) for the second overlapping step exposure to construct an entire curve showing both the toe and the shoulder.
"Clipping" cannot be determined without first defining the enlarging system, printing paper, paper development etc, etc. If the entire tonal scale is required in the print, it can be printed under the right circumstances.
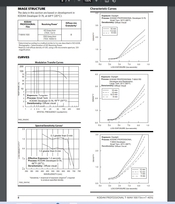
Thanks for the additional info. It's time to expand on why I'm need this information.@BradS gave a very clear explanation already, so I will only post a very crude characteristic curve with an overlaid Zone System "ruler." This shows you how to extract ZS data from Fujifilm's characteristic curve. You get 4-5 stops of usable "dynamic range" before "clipping" occurs, depending on your exposure preferences. Having said that, this is only a very crude approximation. You'd need a lot more data and analysis to fully tease apart all the important parameters. Hope this helps.
View attachment 325464
No Brad, no challenge. I was asking a straight question so I can figure it out for other films as well.
So here's my explanation of your post.
1. Is the graph below your explanation?
2. Is there a way to determine stops each side of 18% gray average or do we just assume it's equal both sides of 18% or +3 stops and - 3 stops?
3. Why .3 per stop? Is that the same for all other curves on their film bulletin sheets?
Alan, I think you've got it! I'll answer your questions below....
1. Yes, The graph you marked up demonstrates what I was trying to say.
2. Short answer. I don't know for sure. It makes sense to me that a "correct" and "useful" light meter reading results in camera settings that place the actual exposure roughly in the middle of the straight line portion of the curve - leaving, in this example 3 stops of latitude on either side. This is the real trick, choosing camera settings that place the actual exposure in the desired place along the horizontal axis. This is (one place) where the photographer comes in. This is roughly what Zone system practitioners are talking about when they say "place Zone ...". They're saying, choose camera settings such that the Zone 5 falls at this place on the horizontal axis. You see, the photographer has freedom to choose where that is, to choose whether to give more exposure in order to get more shadow details for example.
3. This goes back to a time when scientists and engineers used a slide rule (and the CRC handbook) to calculate logarithms. The slide rule works with base 10 logarithms and log10(2) = 0.3. One stop is double or half - that's where the 2 comes from. What we really want is log2(2) = 1. They should have used base two logarithms but that would have necessitated using the slide rule to divide everything by log10(2) or looking up every thing in a table of base two logarithms and do interpolation! So, we're stuck with this goofy use of base 10 logarithm where it makes little sense....because, whereas calculating base ten logarithms with a standard slide rule is easy, calculating base two logarithms with a standard slide rule is tedious.
Why .3 per stop?
It is not at all clear what you are asking. I'll assume that you are asking for the usable exposure range of TMax100.OK Thanks. So looking at Tmax 100, I see around 8-9 stops, depending on how one develops. Since I develop in a lab that uses D76 equivalent, which graph would you use? Which line on that graph?
OK Thanks. So looking at Tmax 100, I see around 8-9 stops, depending on how one develops. Since I develop in a lab that uses D76 equivalent, which graph would you use? Which line on that graph?
I guess the 'trick' is to understand that the horizontal axis is log10(H) - So, a change of 0.3 along the horizontal axis represents doubling exposure, aka, one stop.
Doesn’t the characteristic curve give you that info?
Where would I find the Dynamic Range of film in stops?:
 www.drumscanning.co.uk
1. Chromes?

2. Negative color?
3. B/W negative?
The lab I use develops normally unless you tell them to push or pull. So which curve would you use assuming D76 normally (or XTOL normally in another lab I use.)
The lab I use develops normally unless you tell them to push or pull. So which curve would you use assuming D76 normally (or XTOL normally in another lab I use.)
At those sources who have done proper tests, e.g. me or our member Tim Parkin:
I know Tim and he is a very trustworthy and reliable source.About Us | Professional Drum Scanning
A lot depends on the films (and developers with BW) and on the testing methods. And also on your workflow: There are imaging chains which offer a big dynamic range, and others who limit the DR.
Depending on the film up to 11 stops.
E.g. I have done tests in my test lab / studio in which I've created different contrast ranges with lights on a scene.
The transparencies after that were evaluated optically by eye.
On a light table under a slide loupe I could see about 8 stops with Provia 100F.
With new E100 a little bit (0.3 to 0.5stops) less.
Velvia 50 had about 7 stops, and Velvia 100 about 6.5 stops.
ADOX Scala 50 about 9 stops.
Evaluation of these test shots in projection with my 250W projector on my Da-Lite High-Power screen delivered about 0.5 stops higher values (better shadow detail).
Tim Parkin did tests with his drum scanner resulting in a 10 stops DR with Velvia 50, 11 stops with Provia 100F.
Real Drum Scanners with photo-multiplyers are extremely powerful concerning exploiting the full range of DR with film.
Here an example which shows that capability very impressively. It is a shot by me, heavily underexposed by a former connection problem of the metering in the prism finder of my M645 to the body.
Please scroll down to the portrait of the young lady with the hat:
Beispielbilder
Hier ein Vergleich zwischen einem Scan mit einem Nikon Coolscan 9000ED und dem Heidelberg Tango Trommelscanner nach händischer Konversion. Die Schärfe im Scan mit dem Coolscan 9000ED ist sicher nicht optimal. Das Bild wurde ohne Glasbühne gescannt. Dieser Scanner kann das sicher besser...www.fineartdrumscanning.de
The scan was made with a Heidelberg Tango drumscanner by my friend Sebastian Dziuba. I was totally surprised that he could "save" this underexposed picture. And it shows that there is far more detail on the reversal film and much more DR than expected. Much much more than you would expect if you only look at the official HD curve.
Depending on the film up to 18/19 stops:
Kodak's new Portra 400 film - On Landscape
The messages we hear on forums whenever film is mentioned is that ‘Film is Dead’, no amount of ‘no it just smells funny’ can get people to shut up about it.www.onlandscape.co.uk
Depending on the film up to 14/16 stops.
Some in my opinion very important general statements about the topic Dynamic Range:
It probably is one of the most overrated topics in the sense of being a big problem in photography.
It isn't a big problem because of two facts:
1. For beautiful and very impressive pictures you don't need a high dynamic range at all. Do you know any famous picture which has become famous because of a high dynamic range?
No, because there isn't any picture.
And if your most important details - which tell the "story" of your picture - are placed in either the deep shadows or the high highlights, then you have made something fundamentally wrong with the Gestaltung (framing, design) of your picture.
There is really no reason to be so "obsessive" with high DR as it has become in recent years especially with the digital influencers.
2. If you are really in a situation in which the DR of the scene is bigger than the capability of your film or sensor, then there are lots of different methods available to manage the high contrast of the scene and adjust it successfully to the DR capabilities of your used capturing medium (film, sensor).
We have
- fill-in light (flash, reflectors, other additional light sources), which is one of the best methods by far, because you can measure for the highlights of the scene, and get all the wanted detail in the shadows by the fill-in light; even extremely high scene contrast can be managed that way. You are doing what photographers should do: "Painting with light" by using light.
- gradual ND filters
- pol filter
- exposure and development according to the Zone System (for BW negative film): N+ and N-.
- dodging and burning in print process
- diffuse pre-exposure / pre-flashing.
My experience in my workshops with the participants:
All have cared much to much about the DR of the "sensor", but much to less about all the above mentioned very effective contrast management options.
DR could only be a problem if you let it be that by ignoring the contrast management options.
Best regards,
Henning
I was once brought in to consult with the Herb Ritts team. Their printer had recently begun having difficulties. It became a blame game between her and the shooting crew. I made sensitometric exposures and had the three labs they regularly use process them normally. Two of the labs had good processing, but the lab they had currently been used had +2 development for what they called Normal. You want to know what the lab is really giving you. You need to test.The lab I use develops normally unless you tell them to push or pull. So which curve would you use assuming D76 normally (or XTOL normally in another lab I use.)
| Photrio.com contains affiliate links to products. We may receive a commission for purchases made through these links. To read our full affiliate disclosure statement please click Here. |
PHOTRIO PARTNERS EQUALLY FUNDING OUR COMMUNITY:  |