Bowzart, don't misunderstand the tone of this post, I'm just chatting with you.
I believe (I hope) that I understand enough about the sensitometry behind the ZS to say that this is misguided, I feel anxious as I'm about to make a bold assertion, potentially dangerous

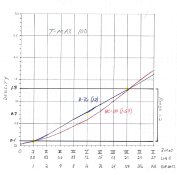
. First, let's agree on the definition of threshhold because that's at the heart of how EI's are determined in the ZS: the amount of exposure needed to yield the first useful density on the negative above the fb+f. So, the relative speed of one curve vs. another is determined by how close to zI the curve crosses the .1 density line. Ex: I have two tests where the original curve crossed the .1 line right at zI, which is great because then I get full box speed with my process for that film/dev combo. All my other tests, the curve crosses the .1 line forward of zI, indicating that with that combo, the speed is too slow to give me a neg density of .1 at zI. So, the amount that I shift the curve back toward zI is the same amount that I take off the box speed to become my EI.
I assume that you actually produced a curve to illlustrate your statement. Your statement says to me and sorry if I got it wrong, that the film/dev/time combo that you used to produce this curve showed that it crossed the 0.1 neg density line at zII. I say this because you said that zII would be the useful threshhold at the box speed of 400 with Edwal 12.
Forgive me while I try to explain myself 
If indeed you assume to want zI to reflect a negative density of 0.1, like you say, then all it would require is that you shift that curve 0.3 log E units to the left on the horizontal axis from zII to zI so that the curve actually does cross the .1 density line at zI--------this is the same as rating the film one stop less at 200 instead of 400 (you asserted 125), with no need to redo the test, just shift the curve a known distance and then you know that if you had used an EI of 200, then your original curve would have crossed the .1 line at zI. That's a very common occurance in ZS testing as far as I can tell. BTW, a lot of this is discussed in John P. Schaefer's Book 2.
____________________
Why 0.3? Because there are 0.3 log E units between each zone on the horizontal axis (this means that .1 log E unit is 1/3 of a stop). Paraphrasing and double checking my facts, I will say that what AA did was to redefine the horizontal axis of the curve by dividing it into zones that are separated by 0.3 log E units, which is an arithmetic factor of 2 as you progress up the scale between zones and one that cuts the values in half as you progress down the scale between zones. This is key because that's exactly what happens when you increase the exposure by one zone----it's a doubling of light intensity or a doubling of time. Or, when reducing by one zone, it's a reduction by half in the intensity of light or the amount of time with the shutter. And that's the beauty of the whole thing, it provides a very practical
"link between camera exposure and the exposure units of sensitometry" (AA, The Negative)
I tried to stop long ago but I could'nt

. The crazy thing about all this BS, is that once a few ambiguous facts are totally understood (I think I've got them, perhaps someone like PE will cut me down
) it becomes crystal clear.
Chuck