-
Welcome to Photrio!Registration is fast and free. Join today to unlock search, see fewer ads, and access all forum features.Click here to sign up
You are using an out of date browser. It may not display this or other websites correctly.
You should upgrade or use an alternative browser.
You should upgrade or use an alternative browser.
Developer Temperature Compensation Formula
-
A
- Thread starter schwefel
- Start date


Recent Classifieds
-
For Sale Rodenstock Apo Sironar N 300mm RARE
- Started by x.rasenas
-
For Sale Leica M9 not working sensor _ for repair
- Started by Manual Camera
-
Want to Buy WTB: 4x4 Resin 81B Filter
- Started by NortheastPhotographic
-
For Sale LINHOF SUPER TECHNIKA III VERSION 5 with Raptar 135, film holders and FP4
- Started by Simon Benton
-
For Sale LINHOF TECHNIKA III ver 5 LENSBOARDS
- Started by Simon Benton
Forum statistics
- Joined
- Sep 20, 2002
- Messages
- 3,699
Differences of opinion are always best discussed verbally IMO. I can remember working with the assistant branch head on a report at NACA. we were in a conference room with the door closed. Others in the outer office heard much loud talk and thought we were at each other's throats. Then we would take a break, go to the Coke machine and flip coins, talk about sports, weather or what not, go back into the conference room and resume making noise. All I remember about the report is that it was an analysis of wing loads measured in flight on a flexible swept wing bomber. It got published.Patrick;
For the numbers you give, based on what we have discussed, you have to give a film and developer to match the data to. I too have reservations about the derivation of our fellow APUG member. I read it earlier and something bothered me so I did not post, but then you are better at math than I am I think.
Patrick, I truly wish we could meet or talk sometime. We have so much information to exchange.
PE
My phone number is 304-4627905. My street address is 2700 3rd Run Road, Glenville, WV 26351. I am about 25 miles from exit 79 on I79. I have a hard time walking any distance because of sacro ileitis. I asked the doctor to translate that. All he said was "Pain in the ass."
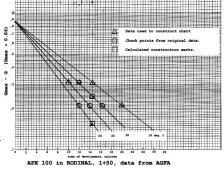
Here, if it goes through, is a chart of the type I have been describing, for APX 100 in Rodinal 1+50. Data read from AGFA chart.
That all makes sense, but it is really no closer to the original topic of the thread!

Have you tried figuring out the mathematical progression of temps on that secondary x axis? This info would be needed to construct a line from, say 19 degrees to the G-Max point (without adding additional empiric data for 19 degrees).
Congratulations on the grandchild!
Developer vs temp with film constant
Patrick;
Congratulations.
IC;
Here is the plot of several Kodak developers as a function of temperature, with the film held constant and the time of development is that which gives the closest match to speed and contrast in all cases.
It is taken from the Kodak Advanced Technical publication J-1 "Processing Chemicals and Formulas for Black-and-White Photography".
PE
Attachments
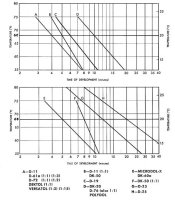
Please note the severe difference in slopes of two of these, and the moderate difference with the rest of them. This indicates that the developers behave differently with temperature. In particular, note DK-50.
PE
PE
- Joined
- Sep 20, 2002
- Messages
- 3,699
That all makes sense, but it is really no closer to the original topic of the thread!
Have you tried figuring out the mathematical progression of temps on that secondary x axis? This info would be needed to construct a line from, say 19 degrees to the G-Max point (without adding additional empiric data for 19 degrees).
Congratulations on the grandchild!
The one chart allows you to see both time and temperature effects on gradient. A horizontal line is a line of constant gradient. A vertical line is a line of constant time. Each sloping line emanating from Gmax is a line of constant temperature. If you draw a horizontal line at the value of Gmax - G that you want, you can pick the necessary time for any temperature or the necessary temperature for any time.
Thanks. It is my youngest grandchild's first child. I have a number of each, and of course all are above average.

- Joined
- Sep 20, 2002
- Messages
- 3,699
Please note the severe difference in slopes of two of these, and the moderate difference with the rest of them. This indicates that the developers behave differently with temperature. In particular, note DK-50.
PE
Yes, each developer is different until proved otherwise, and its interaction with each film is likewise. No matter how you cut it, you need a different chart for each combo. I have found that fact to be true by analyzing the data provided in J-109 for Xtol. Each chart is different, even though the developer is always Xtol, but the deviation of the math model from the actual data is no greater than what might be expected from random experimenal errors.
The ability to represent each family of data presented in J-109 by three properly chosen values of experimentally determined CI is what I was after. For anyone doing such experiments at home with fairly rudimentary equipment, and who wants to use combinations of film and developer that no film or developer manufacture will provide, the ability to get representative results by three experiments should be welcome.
When I say "properly chosen" I mean in an engineering sense. We engineers know that data for such projects should not be too close together in any of the variables because of a see-saw effect. Very small movements near the fulcrum of the see-saw produce much larger movements at the ends. In other words, we always prefer interpolation between measured points over extrapolation beyond measurement.
I can send by email the charts I got by analyzing J-109 data. If you can send or publish here some values of CI, time and temperature for the wild-looking developers for which you gave temperature curves, I'll be glad to see what I come up with.
If I can just try to redirect our thought process toward some utilitarian objective.
1) Room temp. processing of Black and White negatives should be feasible with the computing power easily available on the home computer or a hand-held device.
2) The last charts posted by PE again show that a number of the lines have the same, or similar slopes (close enough for home B&W processing) with just a shift of the x or y axis.
3) My theory still is that it would be possible to construct a spread sheet (like the ones I posted earlier) with say 5 or 7 pages that would have a different slope on each page. Shifts on the x and y axis would be handled within the spread sheet.
An analogy would be a booklet with 5 or 7 Kodak wheels, each with a different equation.
I think PE's response might be that one would need HUNDREDS of 'Kodak wheels' to match all the combinations out there.
My response would be that by accepting some error (again we are talking about helping APUGers develop film in the bathroom or kitchen, not ISO standards) each combination of film/developer could be squeezed into one of the 5 or so equations.
IC;
The slopes differ substantially, especially when one considers that this is semi log paper and therefore the slopes are really tangents to curved lines as has been noted before and shown in previous posts. These plots will be a close approximation for all 8 developers shown if adjusted for the film in question and that is how the wheel works. JGE (Just Good Enough). But, if you want the best results, you need to run the process at 68 degrees or work out an exact time and temperature slope for your film and developer. Kodak offered that wheel as a close approximation for amateurs, not an exact result for professionals or for those demanding highest quality.
It is clear that you wish to do what you feel is best in the face what Patrick and I have said. Well, I do always get down to the fact that I cannot force you to believe what you otherwise hold to be true, and I say use what works for you. The bottom line is that the laws of Thermodyanmics and Kinetics are against giving you exactly what you wish.
PE
Lee L
Member
- Joined
- Nov 17, 2004
- Messages
- 3,288
- Format
- Multi Format
ic-racer,
If you want to start by analyzing some good data, look at Kodak's J-109, the tech info for Xtol. It contains a large number of data points for many films varying by EI, tank size and agitation, temperature, dilution, and target contrast index. You can plug them into a spreadsheet and play with the math. I did some of this in late May and early June myself before this thread got started.
Using the J-109 data would allow you to implement variables for all of the above in any formula(e) that you come up with that would apply to Xtol. It will also allow you to see if it's worth it to generate the same kind of data set for the myriad available combinations of film and developers. That would, however, be a never ending task, as you'd likely have reformulations of emulsions at a rate higher than you could do the tedious data generation.
I also did some analysis of the Dataguide developer wheel and came up with a general formula for the time vs temp adjustment, but if you're using that to its design specs, you're making adjustments for three general film types, long and short toe by film contrast, lens flare, tank and agitation, enlarger type, luminance range, and paper grade before making the temp adjustment.
IIRC, Ilford also has some specific tables that would be helpful with already generated data, not just their generic time vs. temp charts.
Playing with published tech info would save you a lot of testing work.
Lee
Last edited by a moderator:
- Joined
- Sep 20, 2002
- Messages
- 3,699
The very same data that I showed in graph form exists in the form of a spreadsheet produced by the computer program that I wrote some years ago. I have tested the program on the J-109 data and found quite good agreement. I enter three values of CI from J-109 for a particular film (I keep thinking I already said this) and the program computes the other values in that particular spreadsheet. If you would like, I will be glad to e-mail the program. It's only about 50 K. It runs directly on MSDOS machines. I shall try to show a sample of what it prints out.
Attachments
Lee L
Member
- Joined
- Nov 17, 2004
- Messages
- 3,288
- Format
- Multi Format
Patrick,The very same data that I showed in graph form exists in the form of a spreadsheet produced by the computer program that I wrote some years ago. I have tested the program on the J-109 data and found quite good agreement. I enter three values of CI from J-109 for a particular film (I keep thinking I already said this) and the program computes the other values in that particular spreadsheet. If you would like, I will be glad to e-mail the program. It's only about 50 K. It runs directly on MSDOS machines. I shall try to show a sample of what it prints out.
I believe you usually use Rodinal 1:50. Is that the dilution for this data.
Thanks,
Lee
- Joined
- Sep 20, 2002
- Messages
- 3,699
Patrick,
I believe you usually use Rodinal 1:50. Is that the dilution for this data.
Thanks,
Lee
Yes. The data were from AGFA, in the form of curves showing time vs temperature for fixed CI of .55, .65 and .75. You would never suspect by looking at the raw data that you coud get such an orderly plot or spread sheet, but you can see by the graph that the lines derived from the AGFA curves also fit other data points that were not used in deriving the result.
Lee L
Member
- Joined
- Nov 17, 2004
- Messages
- 3,288
- Format
- Multi Format
Yes. The data were from AGFA, in the form of curves showing time vs temperature for fixed CI of .55, .65 and .75. You would never suspect by looking at the raw data that you coud get such an orderly plot or spread sheet, but you can see by the graph that the lines derived from the AGFA curves also fit other data points that were not used in deriving the result.
Thanks Patrick.
One other question about the results from your program. I see what appears to be a coefficient or variable "C", equal to -0.05209 in the case of APX-100 in Rodinal, in the table you posted. I don't see where that fits into the formulae you've posted so far in this thread. Can you straighten me out on that point?
Lee
- Joined
- Sep 20, 2002
- Messages
- 3,699
k(T) is the slope on semilog paper of the line of constant 75 degree temperature. Take the ratio of 2 such slopes, divide that number by the temperature difference, and the log of that number is C. It is supposed to make interpolating or extrapolating new temperature lines "easier".
Lee L
Member
- Joined
- Nov 17, 2004
- Messages
- 3,288
- Format
- Multi Format
Great!k(T) is the slope on semilog paper of the line of constant 75 degree temperature. Take the ratio of 2 such slopes, divide that number by the temperature difference, and the log of that number is C. It is supposed to make interpolating or extrapolating new temperature lines "easier".
So the value for k(68) in your generated table for APX100 in Rodinal is the semilog slope for the constant 68 degree line. This fits with some of the regressions I had done with the J-109 data, but I hadn't thought to relate it to Dmax.
Thanks,
Lee
- Joined
- Sep 20, 2002
- Messages
- 3,699
Sorry fro the late entry here, but I have a calculator at Dead Link Removed. I'll dig up the formula I used. and post soon
TR
It will not even come close for DK-50 1:1. Example: I found Kodak data for Tri-X Pan Pro film. The answer you provided from the query for developing time at 80 degrees for known time of 5.88 minutes at 70 degrees was 3.5 minutes. It should have been 5.07 (call it 5.1). 5.88 minutes at 70 degrees would produce CI of 0.65. 3.5 minutes at 80 degrees would produce CI = 0.52. The reason news phoographers in the days of Speed Graphics is its low sensitivity to changes in temperature. If we had made no change in time between 70 and 80 degrees, the CI would have been 0.70 at 80 degrees. The attached spreadsheet is what I was able to make from the Kodak data from May, 1969. You will notice that the graphs posted by PE show that DK-50 has a much different response to temperature change than average of other films.
Attachments
Correction: ..photographers in the days of Speed Graphics loved DK-50...
Also, ...DK-50 has a much different response to temperature change than average of other developers.
See my post above which proves your point Patrick.
Every developer and film varies.
PE
Lee L
Member
- Joined
- Nov 17, 2004
- Messages
- 3,288
- Format
- Multi Format
I finally got settled back in a bit from a month out of pocket and looked up the results from some analysis of the Kodak Development Dial that I did in late May and early June. At this point though, I'd pursue Gainer's model combining contrast index, time, and temp for individual film/developer combinations as a more successful and specific method.
This mathematical model for the Kodak Darkroom Dataguide Development Dial (discontinued some years ago in favor of tabular data) doesn't account for varying films and developers as has been discussed previously in this thread, and it's a generic formula derived from one part of a somewhat generic tool.
To adjust development time for a change in temperature using degrees Farenheit in a way that conforms closely to the Kodak Development Dial:
New Time = Old Time * exp(-0.0469*(New Temp - Old Temp))
Worst case from Dial #30 through Dial #50 and temperatures between 60F and 80F gets you within +/-4% of matching the results from the dial, much of which is probably noise from Kodak's rounding to 1/4 minute intervals, especially at shorter development times.
The use of this particular formula is not original with me. It can be found at http://covingtoninnovations.com/xtol/index.html (with a very slightly different coefficient) and elsewhere. I don't know the original source for correct attribution. Note that Covington says it works with "most" developers, not all.
BTW, this derivation from the Kodak Development Dial would replicate the error noted in the case of DK-50 as per Gainer's recent comments in this thread, and is subject to the same criticisms that PE made earlier in this thread about ignoring the individual non-linear adjustments made using the several adjunct steps involved in using the Development Dial properly.
Lee
Last edited by a moderator:
Which edition?
Thanks,
Johnny Brian
Hi, Just curious about the source of the graph - I have the 7th edition of publication J-1, and it doesn't have the temperature graph.Here is the plot of several Kodak developers as a function of temperature, with the film held constant and the time of development is that which gives the closest match to speed and contrast in all cases.
It is taken from the Kodak Advanced Technical publication J-1 "Processing Chemicals and Formulas for Black-and-White Photography".
PE
Thanks,
Johnny Brian
The source of the graph is given in the quote from my post above.
PE
PE
- Eugen Mezei
- Deleted
He says the same in the 6th ed. (1946) and every edition up to the 17th. (Good we have archive.org) But than in the 18th (1972) edition he gives the same coeficients but for 10 °F (or 6 °C, as he mentions 2 pages later). I wonder what the reason for this is. It is a huge difference.
https://archive.org/details/cu31924015369055/ page 72:
"The increase in speed of development with an increase of 10°F is taken as the Temperature Coefficient of the developer. For example if we find that a particular developer works twice as quickly at 75°F as it did at 65°F then we say that it has a Temperature Coefficient of 2. The following table gives a rough guide to the time-temperature relationship of the three main types of developer, assuming Temperature Coefficient of 1.8 for standard MQ developers, 1.6 for fine-grain and 2.3 for super fine grain developers."
and on p74: "Thus, each developer has its own Temperature Coefficient. Nevertheless, for most practical purposes, this can be taken as 2. That means that development time should be halved for each 10°F (6°C) rise in temperature."
He repeats that in the 18th revised edition from 1980 https://archive.org/details/DevelopingTheNegativeTechnique/ p. 72 and 74.
The thing is, he has the same factors for 32 years referred to a change of 10 centidegrees. Than suddenly after 16 editions the same factors should be applied for a change of 10 °F, altough he himself says this change represents a significantly lesser change in energy.
Wasn't there a NASA disaster after some of the team used metric (scientists) and others used US customary measures (aeronauticals) and someone was confused? There have been aircraft fueling mishaps for similar reasons.
| Photrio.com contains affiliate links to products. We may receive a commission for purchases made through these links. To read our full affiliate disclosure statement please click Here. |
PHOTRIO PARTNERS EQUALLY FUNDING OUR COMMUNITY:  |