Developer Temperature Compensation Formula

Flowering Chives

H
Flowering Chives

  • 2
  • 0
  • 55
Hiroshima Tower

D
Hiroshima Tower

  • 3
  • 0
  • 51
IMG_7114w.jpg

D
IMG_7114w.jpg

  • 2
  • 0
  • 79
Cycling with wife #1

D
Cycling with wife #1

  • 0
  • 0
  • 75
Papilio glaucus

D
Papilio glaucus

  • 2
  • 0
  • 63

Recent Classifieds

Forum statistics

Threads
198,203
Messages
2,771,016
Members
99,574
Latest member
caseman
Recent bookmarks
0

ic-racer

Member
Joined
Feb 25, 2007
Messages
16,514
Location
USA
Format
Multi Format
DF has shown it well. IC, note that in that table, you are talking about 3 films in 4 different developers and the fact that they may have the same coefficients is merely coincidence. So, in that table, Royal X pan in Polydol behaves like Super XX in HC110 B. In DK-50, these two films are a 34 and a 36 which would be quite far apart. And as the above charts show, behavior is non-linear.

PE
34 and 36 are indeed different numbers and the wheel behavior is non-linear, as I pointed out in my equation for the wheel.

My contention is that there is absolutely no alteration of the temperature-compensation function of the dial based on anything in the chart!

The wheel and chart predict that ALL combinations film/developer with a baseline time/temp of 8min at 20c have the SAME time at 18c!! You can find the time at 18c by using the wheel or the spreadsheet; they give the SAME answer.

Please show me any two film/developer combinations in the chart the have the SAME baseline time at 20c and have DIFFERENT times at 18c based on the wheel and chart!

How can you imply the speadsheet 'may not work' when it gives the same numbers as the wheel?

(PE: this is a 'friendly' gentlemen's argument, so 'no flames' OK. I'll 'eat crow' if you show me to be wrong.)
 
Last edited by a moderator:

Photo Engineer

Subscriber
Joined
Apr 19, 2005
Messages
29,018
Location
Rochester, NY
Format
Multi Format
Well, if I understand you properly, then Verichrome Pan and Tri-X Pan are identical in DK-50 at all temperatures, but are quite different in HC-110B at all temperatures. And, as you point out, since the wheel is non-linear the temperature response is the same in DK-50 but quite different in HC-110B. But look at the post above by D. F. Cardwell if you don't believe me. That is some pretty good data! I have similar Kodak plots.

PE
 

df cardwell

Subscriber
Joined
Jul 16, 2005
Messages
3,357
Location
Dearborn,Mic
Format
Multi Format
Please show me any two film/developer combinations in the chart the have the SAME baseline time at 20c and have DIFFERENT times at 18c based on the wheel and chart!

Here.

From the 1962 'Negative Making' booklet from EKC,
showing Plus-X sheet film. This IS representative.

In the Darkroom Data Guide, the Development Dial # for D-76 is 34, for DK:50 1+1 is 34, and for Microdol is 40.

The Development Dial follows the D-76 curve: 68˚ is 8', 75˚ is tad under 6'.

For DK:50 1+1, the wheel and curve chart agree at 68˚, 6'. The wheel specs 4 1/2 minutes for 75˚ while the chart suggests 5'.

The wheel and chart call out 10' for Microdol at 68˚. At 75˚, the dataguide wants 7 1/3; the chart, 7 3/4.

All in all, the D-76 curve is useful for most film and developer combinations, but ACCURATE for none other than D-76 ! Other films show more dramatic differences, but this shows how it works.

The last published temperature adjust charts Kodak published, as far as I know, was in 1962; by the 1967 the charts were absent from the film booklets and the calculator wheel was in the dataguides. The assumption, and specification, was the dataguide was a starting point.Kodak ALSO published more specific data in table form. Until the advent of TMAX films, the published data was taken with a grain of salt. By the time XTOL was on the market, the data from EKC was dead accurate. A lot had changed, in particular, the state of the darkroom was closer to Lab quality than before. But it is just possible there was a different attitude in behalf of EKC.

The Dataguide, and Development Wheels are valuable, but they seem to follow the 80/20 rule. Assigning a precision to them which they were never intended to possess would be a mistake.
My observation over the years was that Kodak's old data was to get you CLOSE, and SAFE.

Beyond that, you were on your own.
 

Attachments

  • plus-x-sheetstime&temp-62.jpg
    plus-x-sheetstime&temp-62.jpg
    109.7 KB · Views: 126

ic-racer

Member
Joined
Feb 25, 2007
Messages
16,514
Location
USA
Format
Multi Format
Go here: http://kodak.com/global/en/professional/support/techPubs/f4043/f4043.pdf?id=0.2.26.14.17.14.18&lc=en

And, compare D-76 with T-max. At one temperature they are matched, but at another they differ by over 1/2 minute. And, this is the most modern information I can supply. It is quite up to date.

PE

I agree 100%, you are repeating what I mentioned in my prior post

I agree with you 100% that those different film/dev. combos probably won't respond the same, but my wheel says they do, and the equation follows the wheel exactly. The best thing as you are saying would be a separate equations for each combination, but as far as I knew Kodak never provided this until I saw the T-max literature, at which time I deciphered it to come up with a new separate equation for T-max. (2nd spreadsheet posted)

What I am pointing out is that if you use the wheel, those two that you just mentioned will always be matched if they have the same starting time/temp.
 

ic-racer

Member
Joined
Feb 25, 2007
Messages
16,514
Location
USA
Format
Multi Format
If you can see what I am saying or not, does not mater at this point, you have already agreed (though you might not realize) with me that the Kodak wheel cannot predict the temp. behavior of T-max. So lets move ahead with this and see if the wheel can be improved, as we have a mathematical model of it in a spreadsheet.

It would be nice if the temp/time responses of various films could be quantified into 3 or 4 categories. Then the spreadsheet I posted (just a surrogate for the Kodak wheel, really) could have 3 or 4 pages, each page with a different equation for a category of film/developer temp response.

So, I wonder, In your experience, have you noticed a group of characteristic temp responses? If not, then that might dictate a separate spreadsheet page for each combination, which would be overwhelming.
 

Photo Engineer

Subscriber
Joined
Apr 19, 2005
Messages
29,018
Location
Rochester, NY
Format
Multi Format
The behavior of T-max film in 9 developers at 5 temperatures is given on pages 18 - 19 of the Kodak B&W Darkroom Dataguide and is updated as of fall 2007 as I showed on their web site. It is non-linear and different for each developer.

PE
 

ic-racer

Member
Joined
Feb 25, 2007
Messages
16,514
Location
USA
Format
Multi Format
The behavior of T-max film in 9 developers at 5 temperatures is given on pages 18 - 19 of the Kodak B&W Darkroom Dataguide and is updated as of fall 2007 as I showed on their web site. It is non-linear and different for each developer.

PE

Yes, I reviewed these charts and it reminded me of the reason I started decoding the charts in the first place. The carts, as they are, have never been much use for temperature compensation for me because the times in the chart are usually never the same times I am using. So, way back then the question for me was "can I somehow use the info in the chart to figure out my time/temp combinations WITHOUT having to do my own time/temp testing?"

Just for clarity; an example:

Lets say the chart clearly shows 7 min at 20C and 8 min at 24C. I let all my chemicals equilibrate to room temp and they measure 24C so I use 8 min. The problem is what if MY time at 20C is NOT 7 min. In fact it is USUALLY the CASE that my time at 20C it is always something different than the chart. Say my time is 6 min. at 20C. Now the question is what do I do when the temp is 24C?? Because the response curve is not linear, it is not such a simple math problem to do in your head.

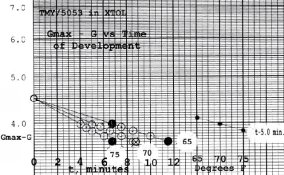
Now, getting to the Table that was mentioned. I did graph the various developer combos with the T-max 400 film and, except for 1 or 2 exceptions, it looks like they follow a similar curve that is shfted on the temperature axis for each developer. It looked like the combined curve could be modeled with a single exponential function or a third order polynomial.
So, YES, the T-max 400 can be modeled with a single curve for MOST of the developers, BUT there will be some ERROR. For B&W work, that error may not be significant but I WON'T comment on it unless it is tested. (The T-max spreadsheet I posted was created with only the T-Max 400 in T-Max developer data).

So, it MAY be possible to model many film/dev combos with just a few different curves (or pages of a spread sheet) assuming one can accept some error.

Also, as far as I know (and I could be very wrong on this) Kodak does not have a way to 'customize' their time/temp table for YOUR PERSONAL development times. If they did, then much of what I just wrote would be moot.

My personal thoughts on the subject:

1) I think developing film at 'room temp' can work well...
2) If you have a good time/temp chart
3) Manufacturers charts frequently don't have YOUR personal developing time listed
4) It IS possible to model a single film/developer combo on a temperature correction spreadsheet showing YOUR personal developing time, or multiple times (N, N+1 etc).
5) It MAY be possible to for someone to collect data to model a number of film/developer combos with just a few different equations.
 

Photo Engineer

Subscriber
Joined
Apr 19, 2005
Messages
29,018
Location
Rochester, NY
Format
Multi Format
#4 is a big change from what you seemed to be saying before.

For a single film and developer it is possible. #5 is done in the various manufacturer's tables, but not with just a few equations. As I've stated, it takes a lot of equations. I have data from the Kodak Advanced B&W databook which is apparently not available now. It shows what has been posted here before. The relationships are very non-linear and therefore not easily reduced to a few equations.

PE
 

gainer

Subscriber
Joined
Sep 20, 2002
Messages
3,699
Plotting effects of temperature change.

I thought I just posted this, but it seems to have found a black hole.

To make a long story short, I have found the the use of semilog graph paper tends to straighten things out, both visually and mentally. I shall try again to submit a chart to illustrate. The film is TMY (not the new version), developer XTOL, data from Kodak.
 

Photo Engineer

Subscriber
Joined
Apr 19, 2005
Messages
29,018
Location
Rochester, NY
Format
Multi Format
Kodak uses semilog coordinates to plot Patrick. It is the norm for this, and for each film and developer, the spacing on the semilog paper is non-linear which makes it even more difficult to make any sort of a general fit.

PE
 

gainer

Subscriber
Joined
Sep 20, 2002
Messages
3,699
Semilog graph

I hope this is what I've been trying to send.
 

gainer

Subscriber
Joined
Sep 20, 2002
Messages
3,699
Kodak uses semilog coordinates to plot Patrick. It is the norm for this, and for each film and developer, the spacing on the semilog paper is non-linear which makes it even more difficult to make any sort of a general fit.

PE

Obviously you didn't see what I tried to send. Whether it is hard to do or not, it was done. I can make a graph of all I need to know about developing any given film in any given developer if I have the data from two tests at one temperature and another test at another temperature. It is especially easy if the two tests at the same temperature were at times in the ratio of 2:1. From these I estimate Gmax (what we used to call gamma infinity). The graph is log (Gmax - G) vs time of development. All such lines for different temperatures emanate from the same value Gmax at t = 0. The task is a bit more difficult if the times are not in the ration 2:1, but Gmax can still be found by trial and error with any two reasonably spaced times. I wrote a little basic program to do that trial and error for me when I used all Kodak data for various films in XTOL. The fit was very good for each film. I found a few obvious klinkers in the Kodak data.
 

Attachments

  • graph2.jpg
    graph2.jpg
    107 KB · Views: 166

Photo Engineer

Subscriber
Joined
Apr 19, 2005
Messages
29,018
Location
Rochester, NY
Format
Multi Format
Patrick;

I was merely commenting that Kodak used the same method. And, as such the data is pretty much as you have shown, but they only do it for one contrast value.

PE
 

gainer

Subscriber
Joined
Sep 20, 2002
Messages
3,699
Patrick;

I was merely commenting that Kodak used the same method. And, as such the data is pretty much as you have shown, but they only do it for one contrast value.

PE

If I seemed a little prickly, it's because I was having trouble getting my graph through to the screen. NOBODY had seen my data at that point, unless they remembered it from a paper in Photo Techniques a few years ago. IIRC, it was titled "Photographers Can Ride on Logs."

The graph actually is an analog of the charging of a capacitor through a fixed resistor to a fixed potential which makes it also a pretty good analog of the developing process as far as the shape of the curve goes. The charging potential is the analogy of Gmax. Gmax doesn't come with the film instructions these days, but the means of calculating it from 2 properly chosen experiments has been around a long time. I found it in Principles of Optics by Hardy & Perrin. The method of doing it by successive approximation from found data where you can't choose the developing times you'd like to have is mine, or at least I like to think so.

The solid black circles show the raw data I used to define the general equation. The two at 65 F defined the slope and Gmax, and the third at 70 F defined that line. The line showing Gmax - G at constant 5 minute development time allowed me to interpolate to make lines for other temperatures. The hollow circles show where other Kodak data fall that were not used in generating the graph. There was no least-squares curve fitting used.

The time constant of the development can be influenced considerably by agitation.
 

Photo Engineer

Subscriber
Joined
Apr 19, 2005
Messages
29,018
Location
Rochester, NY
Format
Multi Format
Well, then, imagine trying to generalize among tantalum capacitors, electrolytic capcitors and etc. They are all different.

BTW, I used to keep a charged 10,000 MFD capacitor on the shelf in my electronics shop most of the time to discourage idiots who visit and try to handle everything! It worked!

PE
 

gainer

Subscriber
Joined
Sep 20, 2002
Messages
3,699
Well, then, imagine trying to generalize among tantalum capacitors, electrolytic capcitors and etc. They are all different.

BTW, I used to keep a charged 10,000 MFD capacitor on the shelf in my electronics shop most of the time to discourage idiots who visit and try to handle everything! It worked!

PE

Yes, but they all have leakage, inductance and internal resistance. That is what makes them differ from one another. The development process should not have the analog of leakage resistance. If it did, it would start to lose the image in the stop bath. I have yet to see the analog of inductance.

In my years at NACA-NASA we had to do our dynamic simulations using analog computers. Digital was only good for some calculations, mostly book keeping. The analog computer had 100 +,- 100 volt op amps, each with two vacuum tubes the size of wine bottles and several smaller ones as preamp. It took about 10 KW to run and had its own air conditioner. We had two crackerjack engineers maintaining the monster. Frequency response, defined by allowable phase shift, was 30 kHz.

A few days ago the French celebrated my 81st birthday. For some reason, they call it Bastille Day. I just realized I'm a little more than 1/3 the age of the United States.
 
Joined
Sep 24, 2003
Messages
1,041
Location
Holland, MI
Format
Pinhole
Happy Birthday, PG (that's Patrick Gainer, not Propylene Glycol), and anyone else who had a birthday in the last year (or 4 years for those born on Feb 29).
 

Photo Engineer

Subscriber
Joined
Apr 19, 2005
Messages
29,018
Location
Rochester, NY
Format
Multi Format
Patrick;

We originally used an analog computer such as you describe at Kodak. And, the operator's name was James Kirk. (His middle initial was not "T"). In any event, hypo can bleach the silver image so it can be made to vanish during fixation.

My point being though that every capacitor has its own characteristics and you agree from what I read. This is also true of films and developers, and the variety and number of results from combinations can be staggering.

PE
 

gainer

Subscriber
Joined
Sep 20, 2002
Messages
3,699
Patrick;

We originally used an analog computer such as you describe at Kodak. And, the operator's name was James Kirk. (His middle initial was not "T"). In any event, hypo can bleach the silver image so it can be made to vanish during fixation.

My point being though that every capacitor has its own characteristics and you agree from what I read. This is also true of films and developers, and the variety and number of results from combinations can be staggering.

PE

Exactly so. All the more reason to attempt to minimize the number of experiments needed to define a characteristic curve. When I saw that all these films plotted as straight lines as log(Gmax - G) vs time and that Gmax for a given film-developer was independent of temperature, it became apparent that 2 experimental determinations of gradient G at one temperature and one determination at another temperature would define all the data provided by Kodak for 1 film. In other words, 3 experiments provided all the information that was contained in 15 by Kodak, and more besides because the effects of times and temperatures not tested can be estimated with good accuracy from the same 3 experiments.

You understand, of course, that random experimental errors can and do occur. It is always best to have more data than the minimum that would be required if there were no experimental error. My preference is to make the 2test times as different as practical and to repeat tests at those times for averaging out errors. Obviously, making one time twice the other would eliminate the use of successive approximation to solve for Gmax.
 

Photo Engineer

Subscriber
Joined
Apr 19, 2005
Messages
29,018
Location
Rochester, NY
Format
Multi Format
Kodak plotted on semilog paper at one gamma, that of the aim for the film. They then went on to plot several films in one developer or one film in several developers. None of these curves were parallel and therefore none could be reduced to a single equation. Even so, none could be reduced to a linear equation.

PE
 

gainer

Subscriber
Joined
Sep 20, 2002
Messages
3,699
You're missing a point. I did not plot gamma against time or temperature. I found the assymptote of the gamma-time curve by a well known equation when values of gamma at times such that t2 = 2 t1. If such data were not available from Kodak, which is most often the case since the data presented were for times to produce specific values of gamma, I used a successive approximation to calculate the gamma infinity from two available times. Now, if you plot the difference between the assymptote and any value of gamma from the curve, you will see the typical exponential decay curve on linear paper, which plots neatly on semilog paper as a straight line. The starting point for this curve is at the assymptote which we often call "gamma infinity" and 0 time of development. Temperature alone has no effect on gamma infinity, so curves for different temperatures emanate from the same point and are also straight lines. It only takes 2 points to define a straight line. After the first line has been defined, the line for any other temperature may be defined by one more experiment because the intersection of the first line with the t=0 axis defines a second point.

I'm sure you have or can access some ordinary charts of gamma vs development time that extend to or near the asymptote. The curve is generally the same shape as the time history of potential on a capacitor being charged through a resistor from a constant source potential. You will see the similarity to an upside-down exponential decay curve. If you subtract each value from the asymptotic value and plot the logs of those values on ordinary graph paper or the values themselves on semilog paper with time on the linear axis, you will see a straight line. This line contains just as much information as the original data.
 
Last edited by a moderator:
Joined
Dec 27, 2004
Messages
475
Location
Arlington, M
Format
Medium Format
That was fun.

I always develop at the same temperature - it's not difficult to control. FYI - I used to be a chemist.
 
Photrio.com contains affiliate links to products. We may receive a commission for purchases made through these links.
To read our full affiliate disclosure statement please click Here.

PHOTRIO PARTNERS EQUALLY FUNDING OUR COMMUNITY:


Ilford ADOX Freestyle Photographic Stearman Press Weldon Color Lab Blue Moon Camera & Machine
Top Bottom