Critical Thinking 2 - Normal Negative Density Range - ZS vs Tone Reproduction

Forum statistics

Threads
198,309
Messages
2,772,720
Members
99,593
Latest member
StephenWu
Recent bookmarks
1
Joined
Jan 7, 2005
Messages
2,608
Location
Los Angeles
Format
4x5 Format
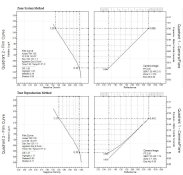
No matter how much you think you understand something, any feelings of complacency are shattered when you have to explain it to someone else. They say no one learns more in a classroom than the teacher. And that pretty much sums it up when I was teaching a class and the lesson was on the Zone System. Like many people, I started with the Zone System, but soon I moved onto more scientific versions of sensitometry and tone reproduction.

When it came time to teach, I had to finally face certain concepts that didn’t seem to match up between what I learn about sensitometry and what the Zone System was explaining. One of these dilemmas is on how to define a normal negative. The basic idea is to process the negative so that the negative density range will fit onto the paper’s log exposure range. While sensitometry uses the method that is described in Chuck’s thread “Testing for Relative ISO Range Numbers”, the Zone System has a set of density aim values for the negative to fit onto a grade 2 paper.

According to sensitometric and tone reproduction theory, a paper with an LER of 1.05 is considered a grade 2 paper; therefore, a negative with a density range of 1.05 should fit nicely onto the paper.

According to Zone System theory, the negative density range for a grade 2 paper is 1.25 (1.35 – 0.10). Sensitometric theory says that is the range for a grade 1 paper and not a grade 2 paper.

Obviously one has to be wrong. Since a negative with a density range of 1.25 will be too contrasty for a LER 1.05 grade 2 paper, it must be the Zone System’s approach that is incorrect. Except that in practice, both methods seem to work. Thus the dilemma.

Some people don’t seem to have problems not questioning such differences. Personally, I had blown off the Zone System values as coming from a less precise, less sophisticated method. That is until I had to explain it and why it still worked. I had to ask myself how two seemingly dissimilar methods that had different stated aim values could produce similar results.

There’s a good reason for it and an important lesson that should be kept in mind by everyone when testing.
 

Hikari

Member
Joined
Dec 12, 2010
Messages
189
Format
Medium Format
Are you also taking into account that there is a loss of contrast in the printing process. The Zone System number may just be compensating for that. I guess if you were making contact prints with a point source, then the density ranges would not match up.
 
OP
OP
Stephen Benskin
Joined
Jan 7, 2005
Messages
2,608
Location
Los Angeles
Format
4x5 Format
What you are referring to is the Callier Coefficient. While it's not stated in the post, the default is generally to diffusion enlargers which are the numbers I used.

Also, won't any influence in the printing process have the same affect on the negatives produced by either method?
 

Chuck_P

Subscriber
Joined
Feb 2, 2004
Messages
2,369
Location
Kentucky
Format
4x5 Format
According to Zone System theory, the negative density range for a grade 2 paper is 1.25 (1.35 – 0.10). Sensitometric theory says that is the range for a grade 1 paper and not a grade 2 paper.

Obviously one has to be wrong...........

Stephen,

I have made such observations myself on this seemingly glaring discrepancy. It's my opinion, but I don't think it can be explained away in mathematical terms---I believe it is a matter of "wiggle room" for aesthetic possibilities, according to AA, as I see it. I'll use a quote that I think sums it up from the third book in his series, The Print:

"A low-contrast negative combined with a high-contrast paper will yield a print in which some compression of light values occurs, and the shadow values may be darker than anticipated because of the effect of the paper-curve "shoulder." Less difficulty occurs when printing a contrasty negative on a soft paper, but standardizing on a Grade 0 or 1 paper leaves us no softer choice for "emergency" requirements. It is therefore best to control the contrast scale of the negative as much as possible, and standardize on a Grade 2 or 3 enlarging paper."
--AA

The above is just something that I think hints at what you are getting at, but of course, I don't know for sure and I don't believe there is necessarily an oversight but it's obviously more than I can really expand upon.

I find these statements interesting as well from The Negative:

"The density values I prefer for diffusion enlargers have a range of about 1.2 (from Value I to Value VIII), which I have found to be optimum for printing on Grade 2 paper. However, the Grade 2 contrast varies among the different manufacturers, and the trend in recent years seems to favor a shorter exposure scale for the so-called normal papers; thus this optimum range must be subject to continual review and revision as required."
--AA

All I can say is that I use that same range in my ZS testing today and it seems to work quite well for me and so I don't question the mathematical alignment, so to speak, of my own results when my eyes, quite simply, like what they see, but I recognize the apparent discrepancy you are speaking about. It makes me wander if the ISO RN's have always been what they are as we understand them today. Meaning, has R105 (i.e., LER 1.05) always been the ISO standard for Grade 2? Perhaps the RN used to be higher for Grade 2, IDK.
 
Last edited by a moderator:

ic-racer

Member
Joined
Feb 25, 2007
Messages
16,523
Location
USA
Format
Multi Format
PRACTICAL THINKING
Here is my take on it: It is moot, because who has an orifice on their densitometer small enough to measure the negative range anyway?:laugh: Mine is 3mm but the optional 1mm opening could still allow 50 leaves and part of a tree...and that is on one of my 8x10 negatives. For 35mm that 3mm could easily encompas an entire automobile and part of the road, etc....


For me, measuring a negative for its density range is indicated in troubleshooting only. I woud not do it on a routine basis. Kind of like driving around with the OBDII monitor hooked to your car. You need it when troubleshooting, but for driving to work every day, its not needed.
 
Last edited by a moderator:

Maris

Member
Joined
Jan 17, 2006
Messages
1,567
Location
Noosa, Australia
Format
Multi Format
I try to produce negatives that have a density range greater (just!) than my target paper grade can record.

The dense parts will correspond to paper-white areas that still read right; specular highlights for example. The thin parts of the negative I consign to maximum paper black; twigs against the sky, gaps in rocks, for example.

Apart from aesthetic considerations small patches (say 2% of the picture area) of pure white and pure black calibrate the eye. Without them a viewer can't be sure if they are looking at a light photograph in a dim room or a dark photograph in a bright room.
 
OP
OP
Stephen Benskin
Joined
Jan 7, 2005
Messages
2,608
Location
Los Angeles
Format
4x5 Format
PRACTICAL THINKING
Here is my take on it: It is moot, because who has an orifice on their densitometer small enough to measure the negative range anyway?:laugh:

I know it's fun to be snarky, but I believe you missed the point. It's about testing and defining testing parameters. You know, sensitometry, step tablets, matching the negative to the paper, what is "Normal"? Then you apply it in real world shooting conditions.

Chuck is doing the right thing with his paper testing. The aim negative density range is determined by the paper's LER. And that's the center of the puzzle. Two testing methods that produce similar to identical results on the same grade of paper yet the aim negative density ranges are different.
 

ic-racer

Member
Joined
Feb 25, 2007
Messages
16,523
Location
USA
Format
Multi Format
matching the negative to the paper,

Actually its all reasonable, but not practical to do. In 30 years I have come down that path many times. Exactly how are you going to measure the negative? You need to know the range of your negative to match to the paper, so you have to measure it by trial and error zeroing in on the highest and lowest areas.
One way to do this is that you can project it and measure the densities with a spot-baseboard meter (Nicholas Lindan method). But this is really my question to you guys (that want to measure the negative) how do you do it, I'm curious? My 'standard' densitometer has too big of an orifice.

What I do to rapidly measure the entire negative area for even the tiny itty-bitty highest and lowest density areas is to project the entire negative onto a piece of MG paper. By adjusting exposure time and contrast filtration I can precisely determine the point where the entire range of important negative values fits on the paper. The cool thing about this method is that when you are done you can frame it.
 
Last edited by a moderator:
OP
OP
Stephen Benskin
Joined
Jan 7, 2005
Messages
2,608
Location
Los Angeles
Format
4x5 Format
I have made such observations myself on this seemingly glaring discrepancy. It's my opinion, but I don't think it can be explained away in mathematical terms---I believe it is a matter of "wiggle room" for aesthetic possibilities, according to AA, as I see it. .

I agree that personal taste plays a roll in determining what type of negative an individual desires. But wiggle room or personal preference isn't an issue in this situation as the two different test methods described above produce almost identical results.

I have to disagree about the math though. As the maximum density for the determination of the LER is 90% of the paper's D-Max, that leaves 10% of the paper's density range that some might like to work with. Also the matching of the negative to the print doesn't guarantee optimum quality. The subject matter, tones, and tonal distribution all play a part. In addition, there's a preference to print with a harder paper with a flat scene and a softer paper with a contrasty scene than what is would be normally indicated by simply matching the materials. And that's all math.

The question you need to be asking yourself has to do with the method of testing as the results appear to be similar. Since the results are similar, the answer has to lies somewhere within the process. Work backwards from the paper's LER. We know the paper's LER is the same as the negative's density range. What are the factors that will produce a negative with the desired negative density range?
 
OP
OP
Stephen Benskin
Joined
Jan 7, 2005
Messages
2,608
Location
Los Angeles
Format
4x5 Format
Yes, exactly how are you going to do that? You need to know the range of your negative to match to the paper. You can project it and measure the densities with a spot-baseboard meter (Nicholas Lindan method). But this is really my question to you guys (that want to measure the negative) how do you do it, I'm curious? My 'standard' densitometer has too big of an orifice.

You're just being blocked and are fixated on measuring the pictorial negative. The testing is done with a step tablet. Once you've determined the contrast index it's all just a matter of input/output.

Although the difficulty of reading the densities off a pictorial negative is part of the answer to the dilemma.
 

ic-racer

Member
Joined
Feb 25, 2007
Messages
16,523
Location
USA
Format
Multi Format
You're just being blocked and are fixated on measuring the pictorial negative. The testing is done with a step tablet. Once you've determined the contrast index it's all just a matter of input/output.

Although the difficulty of reading the densities off a pictorial negative is part of the answer to the dilemma.

Since the range of density values on the negative is determined by both the development and the scene it is clear that Not all negatives have all the density the film can produce. In fact most have only a fraction of the potential range of density.

Are you actually recording the exposure range from the scene, applying that info the the film curve and translating from there to the paper? If that is what is going on, I can see how I got off track in the discussion.
 

Chuck_P

Subscriber
Joined
Feb 2, 2004
Messages
2,369
Location
Kentucky
Format
4x5 Format
Also the matching of the negative to the print doesn't guarantee optimum quality.

Matching the negative to the paper? I don't believe I ever implied that, if so, didn't mean to. That's not ZS practice.......but matching the paper to the negative is. It's enough for me to know that the testing method I use, which is one of those that you speak of, works for me. I'm not interested in knowing the anomoly and I'm not really sure that there really is one. I admit that I'm not articulate and scientific enough to prove it.

In the sense that a standardized negative density range is based off of ensuring that it correlates to a perceived "normal" contrast paper grade, such as grade 2, then yes, I view the calibrated negative as being matched to a "normal" paper contrast.
 
Last edited by a moderator:
OP
OP
Stephen Benskin
Joined
Jan 7, 2005
Messages
2,608
Location
Los Angeles
Format
4x5 Format
Matching the negative to the paper? I don't believe I ever implied that, if so, didn't mean to. That's not ZS practice.......but matching the paper to the negative is. It's enough for me to know that the testing method I use, which is one of those that you speak of, works for me. I'm not interested in knowing the anomoly and I'm not really sure that there really is one. I admit that I'm not articulate and scientific enough to prove it.

Actually, it is. The aim is to print on a given grade of paper. You change the CI of the film based on the scene's luminance range in order for that to happen. This means the paper determines the aim for the negative's density range.

Chuck, you are just beginning to explore paper testing. I'm sorry that you have already determined what is and isn't important to know.
 
Last edited by a moderator:

Usagi

Member
Joined
Apr 17, 2007
Messages
362
Location
Turku, Finla
Format
Multi Format
Does harder grade yield darker shadow values and bloccked highlights like AA wrote?

I have seen tests with almost opposite results: the N+ development can be simulated (or replaced) simply by using harder paper grade. But the opposite does not work. The normal negative cannot be printed on softer grade with same results as it would be N- developed negative on normal grade.

Thus it should be fine to use paper grades insteadof N+ developments and only do N/N- developmemts.
That also gives more room for correcting mistakes. As the too contrasty negative will not be problem too often.
 

Chuck_P

Subscriber
Joined
Feb 2, 2004
Messages
2,369
Location
Kentucky
Format
4x5 Format
Actually, it is. The aim is to print on a given grade of paper.

For users of VC paper, what grade are they aiming for?

For one of the methods of testing that is under consideration here i.e., the ZS method, the aim is to produce a negative density range that closely approximates the exposure scale of "normal" paper. Once that is hashed out, the negative density range is fixed for development times from +2 to -2 until such time that it is determined that it needs adjusting .

You change the CI of the film based on the scene's luminance range in order for that to happen.

It seems you are suggesting here that with changes in negative contrast with development come changes in the negative density range. I'm sorry, in the ZS, this is just not the case. Sorry if I grossly misinterpret what you mean.

I expand or contract the scene SBR to fit within the negative density range established through testing. The negative density range, in the context of ZS, should approximate the exposure scale of "normal" grade 2 paper. With VC paper, it's there for sure, but has to be worked up to, to match the negative. So, increasing or decreasing the contrast of the negative does not mean that the negative density range I have established changes; it does not, it remains the same. This is a key point surrounding the testing involved with the ZS and it's useage in photographing.

This means the paper determines the aim for the negative's density range.

Yes, in the context of the ZS, only in considering what the optimum density range should be on the negative for printing on "normal" paper. I think the bigger question is what is a "normal" paper contrast grade these days. With VC paper, I know the exposure scale that most matches the negative density range is present on the sheet of paper, it's only a matter of working up to it with filtration, but there's room to go harder or softer if needed for aesthetic reasons. So with the paper testing I'm doing, I know the actual paper contrast grade that my filtration settings are producing with my printing system and I believe this to be valuable info to have.

__________
You probably won't agree with just about everything I've mentioned.
 
OP
OP
Stephen Benskin
Joined
Jan 7, 2005
Messages
2,608
Location
Los Angeles
Format
4x5 Format
Let's approach the problem from a different direction. The aim negative density ranges for the example are 1.05 for the tone reproduction approach and 1.25 for the Zone System but that's not the only way to define a negative. There's the film's Contrast Index. To determine what each method considers the aim Contrast Index only requires information about what they considered to be the normal scene luminance range and to plug the aim negative density value and the scene luminance range into the equation for slope - Rise / Run or Negative Density Range / Scene Luminance Range.

For the ZS, it's 7 stops or a luminance range of 2.10. The slope, or film gradient, or equivalent Contrast Index would be 1.25 rise / 2.10 run.

1.25 / 2.10 = 0.595

For Tone Reproduction, the average luminance range is 2.20 which makes the equation:

1.05/2.20 = 0.477

Except Tone Reproduction factors in flare because it actually uses the scene's illuminance range at the film plane. When you develop the film, you are generally developing it for a stop shorter range than would be indicated by the scene's luminance range.

I don't want to confuse anybody, but the average flare is generally considered to be from one stop (0.30) to 1 1/3 stops (0.40). One stop is generally used in the standard model for film speed, but when calculating the scene's illuminance range it is generally either 0.34 or 0.40. Kodak has been using 0.40 for at least the last 30 years, so the equation for slope, gradient, approx CI would be:

1.05 / 2.20 - 0.40 = 0.583

The film gradients for the two methods are almost identical. Which means that whatever the scene's luminance range is the resulting negative density range will be the same for the two methods even though they have different negative density ranges for their aim. If you want to factor in the 1.20 negative density range from the AA quote provided by Chuck, you get:

1.20 / 2.1 = 0.571

Which is just on the other side of 0.58 or practically identical gradients which would yield almost identical results. I've attached two graphs from a tone reproduction program I'm currently writing illustrating how this works except that I've simplified the variables slightly. Instead of using a 2.20 scene luminance range for the Tone Reproduction example, I used a 2.10 luminance range and a one stop flare factor which has the same results as using 2.20 - 0.40. The "HR" value under the "Camera Image" heading represents the scene's illuminance range at the film plane: 2.10 for the non-flare, ZS model and 1.79 (rounding problem) for the Tone Reproduction, one stop flare model.

So, the problem turned out to be two valid but different methods of evaluating information. Technically, both factor in flare, but only with the Tone Reproduction is it apparent.

Even though the testing of the negative for the ZS method is in camera, the conditions produce little to no flare (yes it's a myth that testing with one's camera equipment incorporates shooting conditions), so the test is "comparable" to contacting. The aim negative density range from the testing isn't what the resulting negative density range will be in actually use. The reason why this is missed by so many people was described earlier by ic-racer. It's hard to read the pictorial negative so most people don't and just assume the range is the 1.25 that they tested for instead of the 1.25 range for a seven stop luminance range minus the 1 1/3 stop flare.

(BTW, notice how the flare example has the flare curve at 0.10 and the non-flare curve falling below it? Think ZS speed testing vs ISO and factoring in flare to the evaluation and not.)

What I don't like about the situation between the two methods is that even though the two methods are comparable, I don't think this Adams knew he was using a non-flare situation and automatically factoring in flare. This creates confusion and leads to misinterpretation as to how the photographic process works. Proper testing is only possible when you are aware of all the variables involved. How can you resolve problems without having all the facts necessary for critical analysis?

By approaching the problem from a couple of different directions and obtaining the same answer gives me confidence that I found the correct explanation to the dilemma.
 

Attachments

  • Tone Repro vs ZS.jpg
    Tone Repro vs ZS.jpg
    339.1 KB · Views: 113
OP
OP
Stephen Benskin
Joined
Jan 7, 2005
Messages
2,608
Location
Los Angeles
Format
4x5 Format
It seems you are suggesting here that with changes in negative contrast with development come changes in the negative density range. I'm sorry, in the ZS, this is just not the case. Sorry if I grossly misinterpret what you mean.

It's not what I'm suggesting and yes you have misinterpreted what I said by only 180 degrees. Chuck, you've got to read my posts more closely. You tend to have a knee jerk defensive reaction.

If

Aim Negative Density Range (same as Paper LER) / Scene Luminance Range = CI

Then

CI * Scene Luminance Range = Aim Negative Density Range (LER)

If Scene Luminance Range changes, you need to change the CI in order to maintain the Desired Negative Density Range which is determined by the printing conditions and choice of paper. It's the same as when I said "The aim is to print on a given grade of paper. You change the CI of the film based on the scene's luminance range in order for that to happen. This means the paper determines the aim for the negative's density range." We don't disagree on this. I can't see how you think we do.
 

Jerevan

Member
Joined
Nov 19, 2004
Messages
2,258
Location
Germany/Sweden
Format
Large Format
Sensiometry is a science and the Zone System is a hammer to nail the fine print to the wall.
 

jfdupuis

Member
Joined
Jan 19, 2009
Messages
142
Location
SF Bay Area
Format
Medium Format
Not sure to totally understand the problematic, but what I get from a mathematical point of view is that you are tracing two curves, which are linear, to determine the contrast index of the negative. One that takes into account an offset, the flare, and another that doesn't. I'm therefore not surprise to see that the numbers plugged in both equations are different. Slope need to be adjusted so that both line cross each other at "average" conditions. Discrepancy between the two methods will be accentuated as you move out the average scene luminance range.
 

Hikari

Member
Joined
Dec 12, 2010
Messages
189
Format
Medium Format
What you are referring to is the Callier Coefficient. While it's not stated in the post, the default is generally to diffusion enlargers which are the numbers I used.

Also, won't any influence in the printing process have the same affect on the negatives produced by either method?

Actually, I am not talking about the Callier Coefficent. Rather I am referring to the limitations of the mirror rule, which you are using. The mirror rule works best with linear responses and a perfect/ideal optical system, or, in practical uses, when contact printing. Once you use a real projection system (enlarger), things don't work as well. However, after reading some of the answers here, it seems like you are figuring this out. Slope or CI is a better way to do this rather than a log/density target/value.
 
OP
OP
Stephen Benskin
Joined
Jan 7, 2005
Messages
2,608
Location
Los Angeles
Format
4x5 Format
Slope need to be adjusted so that both line cross each other at "average" conditions. Discrepancy between the two methods will be accentuated as you move out the average scene luminance range.

That's not what this is about. It is to explain a point of theory. It's about how differing testing parameters can produce seemingly different results from the same film curve. It explains the seeming discrepancy between grade 2 LERs for sensitometry (1.05) and the Zone System (1.25). It's an example of the blind men describing an elephant.

The problem is endemic to the Zone System, but you can also see it with plotting curves. It's rare to see a camera image curve. Generally there will be tick marks along the x-axis representing the scene. In the majority of cases, they are placed at intervals of 0.30 log-H units. This represents the scene in one stop intervals with a range of 2.10 log-H for a 7 stop scene. Except that's not how the scene is represented at the film plane. Flare compresses the range. For a one stop flare factor, a 7 stop range will be compressed to 6 stops so the range depicted along the x-axis should be 1.80 log-H. This is illustrated in the spacing of the guidelines between the two quadrants in the above example. I don't have time to scan an example from a book, but open almost any book and you'll see what I mean.

If you read the resulting film density at the 2.10 and 1.80 range, you will have different values. But when you shoot, there won't be any difference because the film has the same contrast. Two different methods, two different values, but no difference in practice because the CI is actually the same. Both are valid testing methods, but only one is descriptive of actual shooting conditions.

I know it's one of those cases where everything appears painfully obvious once it's explained, but how many times have you read that the aim negative density range a for grade 2 is 1.25 (1.35-0.10)?
 
Last edited by a moderator:
OP
OP
Stephen Benskin
Joined
Jan 7, 2005
Messages
2,608
Location
Los Angeles
Format
4x5 Format
Slope or CI is a better way to do this rather than a log/density target/value.

Yes it is and that is why it is in intregal part of the answer. I was using negative density range for the example because that is what is used in ZS methodology and part of the reason for the confusion. As this example helps to prove, it often times provides an insufficient definition.
 

Nicholas Lindan

Advertiser
Advertiser
Joined
Sep 2, 2006
Messages
4,232
Location
Cleveland, Ohio
Format
Multi Format
who has an orifice on their densitometer small enough

Lots of people. Lots and lots of people.

Get thee an enlarging meter - a proper enlarging meter [cough] (can't believe I haven't converted you yet, Mr. Racer):

1) The spot size is about 0.1" on the easel, around the size of the typical highlight - at a 10x enlargement that's equivalent to a 1/100" spot size on the negative.

2) It measures the effective density of the negative in your equipment, and therefore includes Callier effects and system flair.

3) After playing the sensitometry/zone/and beyond game, it becomes a dandy tool for making photographs.

* * *

The first problem with all this methodology is that it tries to boil tone reproduction down to one number - ISO contrast/LER/CI/...

The shape of HD curves vary all over the place. To try and characterize a given curve with one number may have been state-of-the-art in 1929 but doesn't, to my mind, cut it anymore.

The HD curve is a continuum of points. It can not be mathematically defined, nor should it be. It is best to work with the raw curve as it lays.

The second problem is the insistence on using the full range of tones on either the negative or paper. The pictures I have that use the full tonal and informational range look just like drugstore prints, high quality drugstore prints I like to think, but boring dull snapshots all the same unless you are interested in Great Aunt Edna or what Timmy looked like at age 5.

A fine print concentrates it's energies on the range of tones that define the subject - and the tones in the subject almost never go from black to white. The ideal paper is one that has high local contrast in this range of tones. There is no point worrying too much about detail in the unimportant parts of the image as too much detail there just distracts; instead the unimportant parts of the image form part of the frame and often get flashed or burned into obscurity.
 
Last edited by a moderator:
Photrio.com contains affiliate links to products. We may receive a commission for purchases made through these links.
To read our full affiliate disclosure statement please click Here.

PHOTRIO PARTNERS EQUALLY FUNDING OUR COMMUNITY:


Ilford ADOX Freestyle Photographic Stearman Press Weldon Color Lab Blue Moon Camera & Machine
Top Bottom