I thought your post was clear, I just provided comment on a point that I disagreed with
Being that it wasn't about density range, then you must have disagreed with an imaginary post. I've written rather extensively about the negative density range and the importance of determining how to measure it. Here I was discussing how once the density range is determined (development), the entire range can be moved up and down the film curve through exposure. As long as the placement doesn't negatively affect a portion of the curve, the prints will be similar.
My problem with Barnbaum is the way he describes it. If the intention is to print a Zone III shadow value on Zone III, then you're not placing a Zone III shadow value on Zone IV. You are simply giving the entire range an additional stop of exposure. There is no difference than simply changing the film's EI. In fact, Barnbaum could simply state that he opens up two stops from the ISO speed. Ever heard of the photographer who sets his EI at 1/2 the ISO speed then stops down one stop when shooting? There is a distinction between shifting the Zone III shadow to print on Zone IV and just giving everything an extra stop of exposure.
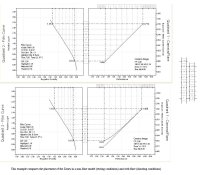
This is part of why I said, "I keep trying to make is there isn't a fixed correlation between Zones and negative densities. Over-exposing the film simply moves everything toward the right on the film curve." Exposure, curve shape, and flare combine to make it impossible to have exact negative density aims for the various Zones (outside of testing). I've uploaded some examples to help illustrate this.
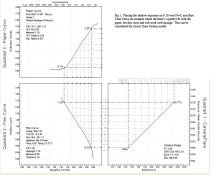
Figures 1 and 2 show how additional exposure shift the entire exposure up the curve and that it is then "printed down" producing almost identical prints. The negative density changes only slightly with the increase curve gradient as the shadows move off the toe.
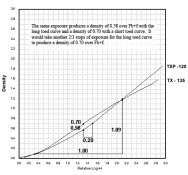
The long and short toed film comparison shows how an identical exposure will produce different density values depending on the curve shape. In this example, point of exposure can be considered Zone V. For the long curve to produce the same 0.70 density value, it would require an additional 2/3 of a stop exposure. How would that work if Zones had a specific correlating density?
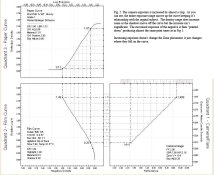
The final example shows the difference in Zone placement between a non-flare example and a flare example. The flare example can vary depending on the degree of camera flare, but the non-flare conditions only exist under testing conditions. In this example, which has the exposure keyed to 0.10 density, has the Zone V shooting exposure falling at the point of the Zone IV testing exposure.
One other thought. Barnbaum's tends to be a flame thrower. He wants to be an iconoclast. And while I've found the explanations in his book to be from another planet, I believe he's just trying to be provocative with his statement about exposure. What's actually going on is no big deal.
If Barnbaum's approach is so outlandish, then so should Ralph's. His 0.17 speed point can easily be within 1/2 stop of Barnbaum's approach. Ralph's 0.17 speed point idea increases the EI by 1/2 to 2/3 of a stop. This is on top of the general increase of 1/2 to 1 stop in the EI that comes from Zone System testing. Potentially, we could be talking about a 1 2/3 stop difference over the ISO speed as opposed to Barnbaum's 2 stops over. You can't defend one and denounce the other.
Attachments
Last edited by a moderator: