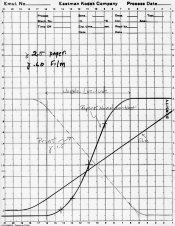
What is x and what is y?
I hope y is density and x is log of exposure in lux.seconds?
I hope y is density and x is log of exposure in lux.seconds?


This means that for a characteristic curve, you'd better include some points through the shoulder and toe regions, and the further out you can get data from those regions, the better.
What is x and what is y?
I hope y is density and x is log of exposure in lux.seconds?
You don't really need to bother with fitting all the stuff on the straight line portion, so why bother with it!
The problem is building the integrating light "sphere".
Actually some film developers seem to have a very wavy straight line portion. The FineArt Photo Supply stuff that was so hyped by them was terrible in this regard. Terrible, unless it happened to increase and decrease contrast just where you wanted it. But it would be a crap shoot (literally) for any image. SO it's at least good to check the straight line portion.
Yes, those are the values I used. I calculate exposure by metering with my ambient meter with a flat dome and then I convert EV into lux. I use 1 second exposures so the exposure is lux-seconds.
3) I have an itch.
Are you trying to determine film speed and paper range? Well, you really only need to know the data at the toe and at some point up the "straight line" portion of the density range. What's between is not needed to determine film speed and paper range.
Certainly you can learn a lot about a film and how it acts in a developer by looking at the whole range, but you don't need it for calculations here.
I've found that film curves are fairly easy to get a polynomial to fit with, but paper curves don't work so well. I hope the cubic spline is going to work well for this.
The solving for Y=.1 is exactly what I am hoping to accomplish programatically. I may need to go to an iterative estimate (just now looking at some CubicSpline code), but it should be more than good enough for what I want. It's not like I will need to efficiently solve millions of them a second.
You probably want to take a look at Curvexpert 1.34 at http://userpages.xfoneusa.net/~dhyams/cmain.htm
Lee
But solving it for Y=0.1 is time consuming, even with a computer.
And the only thing that's going to stop that itch is more cowbell. I need more cowbell!

This stuff is fascinating, but a little over my head- could one of you guys explain in layman's terms how this type of analysis fits into your image making process?
Is it that, knowing the density curve of the film enables you to place your image densities on the optimal portion? :confused:
| Photrio.com contains affiliate links to products. We may receive a commission for purchases made through these links. To read our full affiliate disclosure statement please click Here. |
PHOTRIO PARTNERS EQUALLY FUNDING OUR COMMUNITY:  |