Why is Zone System EI often about half rated ISO/ASA?

Sciuridae

A
Sciuridae

  • 2
  • 2
  • 76
Takatoriyama

D
Takatoriyama

  • 5
  • 3
  • 106
Tree and reflection

H
Tree and reflection

  • 2
  • 0
  • 91
CK341

A
CK341

  • 5
  • 1
  • 100
Plum, Sun, Shade.jpeg

A
Plum, Sun, Shade.jpeg

  • sly
  • May 8, 2025
  • 3
  • 0
  • 122

Recent Classifieds

Forum statistics

Threads
197,628
Messages
2,762,161
Members
99,425
Latest member
dcy
Recent bookmarks
1
Joined
Jan 7, 2005
Messages
2,603
Location
Los Angeles
Format
4x5 Format
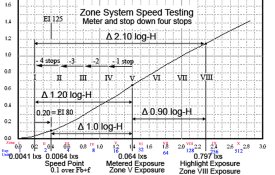
Back to why Zone System and ISO "speeds" are different. With the Zone System, you meter a target and stop down four stops. In the example below, the ISO speed of the film is 125. That means the exposure at 0.10 over Fb+f is 0.0064 lxs making 0.8 / 0.0064 = 125. The metered exposure is 8 / 125 = 0.064. Four stops down from the metered exposure is the exposure 0.0041 or too low for the 0.10 density speed point. In order for the four stops down exposure to fall at 0.10 over Fb+f it requires 2/3 stop more exposure. One way to do this is to rate the 125 speed film at 80.

Why ZS and ISO Speeds are different.jpg

Yes, I am repeating myself, but hopefully in a slightly different way. So Bill, except for experimental error, for general purpose developers this is the primary reason why Zone System EIs and ISO speeds are different.
 
OP
OP
Bill Burk

Bill Burk

Subscriber
Joined
Feb 9, 2010
Messages
9,153
Format
4x5 Format
With the Zone System, you meter a target and stop down four stops. In the example below, the ISO speed of the film is 125. That means the exposure at 0.10 over Fb+f is 0.0064 lxs making 0.8 / 0.0064 = 125. The metered exposure is 8 / 125 = 0.064. Four stops down from the metered exposure is the exposure 0.0041 or too low for the 0.10 density speed point. In order for the four stops down exposure to fall at 0.10 over Fb+f it requires 2/3 stop more exposure. One way to do this is to rate the 125 speed film at 80.

Well, now THAT is one heck of a good, simple explanation.

And it explains why an Incident Meter reading, won't agree with a Spot Meter reading, where the shadow is Placed on Zone (shadow Zone of your choice).
 
OP
OP
Bill Burk

Bill Burk

Subscriber
Joined
Feb 9, 2010
Messages
9,153
Format
4x5 Format
Hi Andreas,

Part of why I asked the question. I think the practical implication is that when you Place Shadows on Zone II, you fundamentally make the "2/3 stop" adjustment (even though you make a whole stop).
 

DREW WILEY

Member
Joined
Jul 14, 2011
Messages
13,742
Format
8x10 Format
I use exactly none of above systems, with the exception of simply labeling sheet film shots that need
other than "normal" development, and need to be otherwise lumped into N+1, N-1, etc batch sessions.
What I do is almost instinctively or instantly visualize the actual developed film curve in my head, and
where on it I want to place specific spotmeter values. It's a helluva lot more accurate than any kind of
math forumla or generic zone model. I can readily switch between different films, lighting ratios, developers and timing, filters, the whole nine yards, and nearly always nail it spot on. Interpretation of
a neg onto print all transpires in the darkroom anyway. After you've done enough densitometer plotting
and have enough field and darkroom experience, it all seems to become intuitive. I've even worked without a light meter just from memory of analogous settings. .. and I never rely on the "latitude" of a
film. I want to know exactly how the shadows, midtones, and highlight are going to differentiate. Might
initially sound tricky, but having first been schooled (school of hard knocks) by shooting and printing
chromes, black and white exposure is relatively easy to cope with.
 

Steve Smith

Member
Joined
May 3, 2006
Messages
9,109
Location
Ryde, Isle o
Format
Medium Format
When I started to read about personal film speed, I found lots of websites showing detailed tests to do with a range of exposures and developing times.

Almost all of them came to the same conclusion - Halve the speed and decrease the development time by about 25%.

That was enough for me. Rather than do the tests myself, I just tried HP5+ at EI 200 and developed it for 75% of the ISO 400 time.

I liked the results so kept doing it.


Steve.
 

DREW WILEY

Member
Joined
Jul 14, 2011
Messages
13,742
Format
8x10 Format
Everything in the real world. Does your subject land anywhere on something other than a totally predictable straight-line part of the curve. Of course it does. You've got gradation curves inherent to
shadows and highlights, and what you do to midtone expansion affects your choice of how this works.
ASA is really arbitrary in this respect, even from one shot to another with the same film. What counts is how you actually distribute specific parts of the scene onto the curve geometry. The Zone System is
just a generalized way to classify how you go about this, which you can make as simple or as complicated as you with. Walking around with a calculator and some other model might work perfectly
well for someone else. But in effect, you are still altering your ASA whenever you change your endpoints
or midpoint. It's all relative. Hypothetically, I might even want to blank out the shadows ala Brett Weston, but gotta know what's going on at the bottom of the curve, regardless of ASA. One film will
do it, another will just leave you with mud, even though under ordinary circumstances you would assign
them exactly the same ASA. I guess you could go around with a pocket computer programmed with
calculus and fiddle with all kinds of silly integers or micro-hedgehogs in it or whatever. If that's the kind
of thing you enjoy, fine. I do plenty of densitometer work in the lab when it's actually relevant. But in
the field I want to instinctively know what's going to happen under a wide and often suddenly-changing
scope of lighting. The way I conceive of ASA might shift just as fast.
 
Joined
Jan 7, 2005
Messages
2,603
Location
Los Angeles
Format
4x5 Format
I think getting a yes, or no answer would make it easier to understand.

Well, no it really wouldn't. I'll try to put something together. In the mean time, what part of my explanation so far don't you understand?

Would this mean if I translated the ISO speed point into a zone would it lie at zone 0 1/3 from the view point of the ZS?

What makes you think it would?
 
Last edited by a moderator:

Chuck_P

Subscriber
Joined
Feb 2, 2004
Messages
2,369
Location
Kentucky
Format
4x5 Format
In order for the four stops down exposure to fall at 0.10 over Fb+f it requires 2/3 stop more exposure. One way to do this is to rate the 125 speed film at 80.

Finding the ZS EI in Schaefer is described this way as well. Not really informing you of anything here Stephen (It's merits can be argued against some other perceived better way, but it's how I do it), but just for others who care------if, after plotting the curve, an ISO 400 film does not attain a 0.1D until Zone II, for example, then all the curve data points would then be shifted 0.3 log exposure units to the left and the curve redrawn, and an EI of 200 is then assigned. The redrawn curve then represents a characteritic as if the original curve was produced at an EI of 200 (no need to produce another curve at EI 200). The ISO 125 curve reaches 0.1D at Zone I 2/3, therefore would simply be redrawn after each data point of the curve was shifted 0.2 log exp units to the left to represent the curve at an EI of 80.

Only, the horizontal axis in Schaefer is not divided in 0.2 log exp units, as is presented by your graph, but is shown with major divisions at 0.3 log exp units (as in The Negative), the attachment shows the differences; also, there would be a Zone 0 indicated without an exposure unit applied. The log value of each exposure unit, starting at Zone I, jives nicely with zone divisions at 0.3 units of log exposure, the most important log value, of course, being log10 of 2 = 0.3. I just think it makes looking at curves easier, probably a trivial thing to mention to most, but that's just my opinion.
 

Attachments

  • test3.jpg
    test3.jpg
    439.2 KB · Views: 115
Joined
Jan 7, 2005
Messages
2,603
Location
Los Angeles
Format
4x5 Format
Only, the horizontal axis in Schaefer is not divided in 0.2 log exp units, as is presented by your graph, but is shown with major divisions at 0.3 log exp units (as in The Negative), the attachment shows the differences; also, there would be a Zone 0 indicated without an exposure unit applied. The log value of each exposure unit, starting at Zone I, jives nicely with zone divisions at 0.3 units of log exposure, the most important log value, of course, being log10 of 2 = 0.3. I just think it makes looking at curves easier, probably a trivial thing to mention to most, but that's just my opinion.

I based the design off a graph from Kodak's R&D department or at least from the couple of sheets Dick Dickerson gave me. Each dot is Δ0.02 logs apart. Each square is Δ0.1 log. The solid lines represent Δ1.0 logs. The coordinates are labeled every 0.2 logs. This design is very good for easy to read precision plotting, especially by hand. For my four quadrant curves which are meant to incorporate a larger view of the process has the coordinates labeled in Δ0.30 log intervals.

A quick look through Schaefer's book shows that while he does have coordinates at Δ0.30 log intervals (actually labeled in Zones), he also used graphs with the coordinates labeled every Δ0.20 logs.

Schaefer example.jpg
 
Last edited by a moderator:
OP
OP
Bill Burk

Bill Burk

Subscriber
Joined
Feb 9, 2010
Messages
9,153
Format
4x5 Format
Would this mean if I translated the ISO speed point into a zone would it lie at zone 0 1/3 from the view point of the ZS?

No.

I think you went the wrong direction. More like Zone I 2/3 (that's why I said place shadows on Zone II - close enough).

But, come to think about it. Now if I did use a lower EI... And I still place my Shadow on Zone II - It's like I really placed my shadows on Zone III.

Gets messy real fast.

Fortunately that isn't a "bad" exposure.
 
Joined
Jan 7, 2005
Messages
2,603
Location
Los Angeles
Format
4x5 Format
Andreas, what you’re wanting to do is compare two different lengths of measurement that start at the same point and want to end at the same point. If we lay both lengths down with one end of each flush at the same point, one of the lengths will be 1.20 – 1.00 = 0.20 Δ log-H longer than the other. If one end of each measurement begins at the metered exposure point on the film’s characteristic curve, an exposure of 8 / film speed, the end of the shorter, 1.0 Δ log-H, length measurement will fall at 0.8 / film speed where the film density is 0.10 over film base plus fog. The end of the other length of measurement, 1.20 Δ log-H, will be 0.20 Δ log-H further down.

Under these conditions, the 1.0 length measurement will fall at a relative Zone I 2/3, but the problem is Zone I needs to fall at 0.10 over Fb+f. So exposure needs to be increased by 2/3 of a stop. The 1.20 length is moved to the right so that the ends of both measurement lengths are at the same point, but now the starting ends fall at different points. A variable has changed with the 1.20 Δ log-H length of measurement, but not with the 1.0 Δ log-H length of measurement. It’s not possible to make a direct comparison under these conditions.

I don't know if this is going to help or not. It's a breakdown of exposure for an average scene luminance range for a film speed of 125 without flare. The Zone indications are on the left. The metered exposure is on step 10 at 0.064 lxs. The speed point is Δ1.0 log-H further down on step 20 at 0.0064 lxs. Zone I falls at step 22 or 2/3rd of a stop below speed point.

Exposure for 125 speed film.jpg
 
Last edited by a moderator:

Chuck_P

Subscriber
Joined
Feb 2, 2004
Messages
2,369
Location
Kentucky
Format
4x5 Format
A quick look through Schaefer's book shows that while he does have coordinates at Δ0.30 log intervals (actually labeled in Zones), he also used graphs with the coordinates labeled every Δ0.20 logs.

View attachment 65814

Yeah, that's in a part(s) of the book that I never have gotten into---Specialty Black and White Films, Alternative Processes, etc.....but within the context of the ZS and testing discussions, it'll be found the other way----I should've been more specific than just referrencing Shaefer alone.
 

AndreasT

Member
Joined
Sep 15, 2006
Messages
326
Location
Berlin
Format
Multi Format
Well, no it really wouldn't. I'll try to put something together. In the mean time, what part of my explanation so far don't you understand?


What makes you think it would?
I came to this conclusion because of the lower ISO rating with the ZS. Well I just going to have to reread all this and think. It is starting to hurt.
 
Joined
Jan 7, 2005
Messages
2,603
Location
Los Angeles
Format
4x5 Format
Maybe this will help.

Zone System vs ISO.jpg

What is basically happening is the Zone System test changes the ratio between the speed point and the metered exposure from the ISO's Δ1.00 (10x) to the Zone Systems Δ1.20 (16x). It isn't so much about determining film speed.

The examples deal with exposure in testing and not exposure placement in use. Flare still has to be added to the mix.
 
Last edited by a moderator:
OP
OP
Bill Burk

Bill Burk

Subscriber
Joined
Feb 9, 2010
Messages
9,153
Format
4x5 Format
Maybe this will help.

View attachment 65880

What is basically happening is the Zone System test changes the ratio between the speed point and the metered exposure from the ISO's Δ1.00 (10x) to the Zone Systems Δ1.20 (16x). It isn't so much about determining film speed.

The examples deal with exposure in testing and not exposure placement in use. Flare still has to be added to the mix.

AndreasT,

This is 2/3 of a stop, already, towards ZS test results in lower speed than ISO test results. The film speed has not changed in this example.

2/3 stop is already gone. Just because of how you use the meter in Zone System. That is a big part of the reason.

Then, as Stephen says, flare has to be added to the mix. I also assert that for Zone System testing, you also develop for less time. This moves the 0.1 density further to the right (slower).

So while you could stop right here and see 2/3 of a stop is gone.

I believe other things move the speed difference between Zone System and ISO, left or right (faster or slower), more or less giving you a final result of Zone System having one full stop below ISO.

So once you get this one big one settled in your mind, we can start looking at the other little details. I like to finish with flare, because it's the hardest. But flare is a big one.
 
Joined
Jan 7, 2005
Messages
2,603
Location
Los Angeles
Format
4x5 Format
I also assert that for Zone System testing, you also develop for less time. This moves the 0.1 density further to the right (slower).

ZS normal is around CI 0.58. Using a fixed density method for EI determination, the difference between the ISO contrast parameters and the Zone System method of determining contrast, the fixed density point will shift slightly to the left. Probably not a full Δ0.10 but contributing as Bill said. With the fractional gradient method / Delta-X criterion, there would be negligible difference in speed.

The range of EIs from most Zone System testing is generally from 1/2 to 1 stop slower than the ISO speed. I believe imprecision of using the camera's f/stop in ZS testing and experimental error are the major causes of the variance.
 
Last edited by a moderator:

AndreasT

Member
Joined
Sep 15, 2006
Messages
326
Location
Berlin
Format
Multi Format
I was reading a bit today and looking at the the various graphs. It does all make sence, it just hasen't become second nature yet. I will need a bit of time before knowing this well.
My next question has been mentined already above. My next question was now concerning flare in the ZS and the shifting of the densities through the greater exposure.
Flare would now raise the densities on the toe. Are we then landing above the 0.1 speed point?
 
Joined
Jan 7, 2005
Messages
2,603
Location
Los Angeles
Format
4x5 Format
In this example, the curve on the left shows where Zone placement will fall when Zone I is placed at 0.10 over Fb+f and without factoring in flare. The curve on the right takes the 0.10 density placement of the curve on the left, but incorporates a 1 stop flare factor.

Zone and Flare - No flare and 1 stop flare.jpg

What do you think would happen to the Zone placement if instead of having to increase the EI by 2/3 to 1 stop, rate the film at the ISO and then factor in flare?
 
OP
OP
Bill Burk

Bill Burk

Subscriber
Joined
Feb 9, 2010
Messages
9,153
Format
4x5 Format
ZS normal is around CI 0.58. Using a fixed density method for EI determination, the difference between the ISO contrast parameters and the Zone System method of determining contrast, the fixed density point will shift slightly to the left. Probably not a full Δ0.10 but contributing as Bill said. With the fractional gradient method / Delta-X criterion, there would be negligible difference in speed.

The range of EIs from most Zone System testing is generally from 1/2 to 1 stop slower than the ISO speed. I believe imprecision of using the camera's f/stop in ZS testing and experimental error are the major causes of the variance.

Right.

To clarify, a couple points:

There may not be a "real" speed difference, because fractional gradient and Delta-x say so. But because fixed density 0.1 is the Zone I target, there will be a numeric speed loss.

You lose this speed because you develop to approximately 0.58 gradient for Zone System versus approximately 0.62 gradient for ISO.

The difference between ISO and Zone System due to this fact... I agree... is "probably not as much as" Δ0.10 logE.

We can't lock down how much. One reason it can't be locked down: "Grade 2" paper of different manufacturers may have different characteristics, so the y-axis Δdensity is not locked down in Zone System standards. Sure we can give some examples of what some people get for actual difference on logE scale. But no matter what, this is going to be one of those "approximate" numbers.

Here is a new intrigue: We have a numeric calculation result in a lower EI. But the "real" influence of this factor is effectively "nothing". We changed a number we didn't have to. Later on this MUST come back to haunt us. We must have to make this up or cancel this out in practice!
 

AndreasT

Member
Joined
Sep 15, 2006
Messages
326
Location
Berlin
Format
Multi Format
So theoretically if we keep the ISO speed, add in flare we could be alright.
If I look at the latest graph from Stephen we need to decrease exposure using the ZS model, but we would need to increase development to compensate the higher zones.
 
OP
OP
Bill Burk

Bill Burk

Subscriber
Joined
Feb 9, 2010
Messages
9,153
Format
4x5 Format
So theoretically if we keep the ISO speed, add in flare we could be alright.
If I look at the latest graph from Stephen we need to decrease exposure using the ZS model, but we would need to increase development to compensate the higher zones.

You were right the first time. If you place shadows on Zone I, they will fall around where you think Zone II should fall. The shadows will fall above 0.1 density.

Now you can't really get the shadows to fall to 0.1 density by decreasing exposure. You would have to drastically underexpose and it will hurt the picture. So accept the fact that "flare helped the shadows come up".
 
Photrio.com contains affiliate links to products. We may receive a commission for purchases made through these links.
To read our full affiliate disclosure statement please click Here.

PHOTRIO PARTNERS EQUALLY FUNDING OUR COMMUNITY:


Ilford ADOX Freestyle Photographic Stearman Press Weldon Color Lab Blue Moon Camera & Machine
Top Bottom