Sure thing. I use matplotlib and scipy for a lot of my work. matplotlib is a plotting package that does all of the graphical work. It's pretty easy to use once you get the hang of it. It requires the numpy package, which is a very nice array module, along with some lightweight math functions (simple polynomial fits, ffts, etc.). Scipy is the heavy duty scientific package with modules for integration, interpolation, curve fitting, etc.
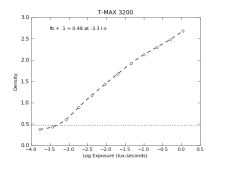
I've attached a plot and the code I used. I snatched some data from the Kodak pdf on T-Max 3200, one of the curves for T-Max dev I think in a small tank, the 13 min development time. I sampled 12 points off that curve to use as my starting point. I then generated a spline, an array of x values to fill in the blanks, and evaluated the spline at those values. The original data is plotted in white circles, the spline fit is the dashed line. I then figured out what fb+.1 was by searching for the minimum y value of the spline + .1. fb + .1 is printed at the top, and is also shown in the dotted horizontal line.
You can see the code is only 26 lines long, including a couple blank lines thrown in. The first 9 lines are just importing modules and defining the data. Lines 10-13 are the actual spline fit, evaluation, and figuring out what fb+.1 is. The rest is just plotting.