• Welcome to Photrio!
    Registration is fast and free. Join today to unlock search, see fewer ads, and access all forum features.
    Click here to sign up

Understanding the characteristic print curve

ptloboscarmelEIR3.jpg

A
ptloboscarmelEIR3.jpg

  • jhw
  • Dec 15, 2025
  • 0
  • 0
  • 12
Tree Farm

H
Tree Farm

  • 1
  • 0
  • 39

Forum statistics

Threads
201,212
Messages
2,820,523
Members
100,589
Latest member
rando
Recent bookmarks
0

Doc W

Member
Allowing Ads
Joined
Nov 7, 2009
Messages
955
Location
Ottawa, Cana
Format
Large Format
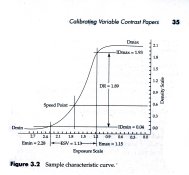
I am reading Steve Anchell's book on variable contrast printing and there is one point, which seems absolutely fundamental to his whole approach, that I just can't get. On page 35 (depending on edition), he presents the characteristic curve for paper. On the vertical axis is density, running from 0.0 to 2.1. No problem. The horizontal axis, however, is exposure and it runs from 2.7 to 0.0. Thus, the more exposure, the less density on the paper, which makes no sense. What am I not getting?

I realize that this may be a really dumb question but it wouldn't be the first time I asked one in this forum.
print curve-001.jpg
 

Attachments

  • print curve-001.jpg
    print curve-001.jpg
    382.3 KB · Views: 817

spijker

Member
Allowing Ads
Joined
Mar 20, 2007
Messages
628
Location
Ottawa, Canada
Format
Medium Format
Does the book present a formula besides the graph? Maybe the book defines exposure as something like:
Exp(Constant - E)
where E is plotted in the graph. Just a guess. :smile:

Menno
 

RobC

Member
Allowing Ads
Joined
Nov 5, 2007
Messages
3,880
Location
UK
Format
Multi Format
that x axis is negative density so the higher its value the less exposure the print gets and the lighter it is.

And remember of course that the toe of a print is the highlights and the shoulder the shadows for anyone confused by it.
 

MattKing

Moderator
Moderator
Allowing Ads
Joined
Apr 24, 2005
Messages
54,718
Location
Delta, BC Canada
Format
Medium Format
I expect that the curve measures reflected light. Where the paper reaches dMax, the amount of light reflected is at a minimum.
 

RobC

Member
Allowing Ads
Joined
Nov 5, 2007
Messages
3,880
Location
UK
Format
Multi Format
excellent book by the way for anyone wanting to understand print contrast and control
 

chrisaisenbrey

Member
Allowing Ads
Joined
Jan 9, 2011
Messages
154
Location
Kehl/Strasbo
Format
Multi Format
Perhaps the horizontal scale matches film's density.

Yes I think so too. Probably the density of the 21 step Stouffer used for the measurement.

For a real negative it would be a little overexposed, if the shadows start at around 1.
 
Last edited:

ic-racer

Member
Allowing Ads
Joined
Feb 25, 2007
Messages
16,694
Location
USA
Format
Multi Format
Numbers to the left of zero are negative.
 
OP
OP
Doc W

Doc W

Member
Allowing Ads
Joined
Nov 7, 2009
Messages
955
Location
Ottawa, Cana
Format
Large Format
Thanks guys. I think I have it figured out now. As many of you have said, these are negative numbers or film density, thus the less exposure, the less density in the print.

Due to my limited grasp of math and graphs, I sometimes get stopped dead in the water when I can't quite sort out a small detail. But I am now forging ahead.
 

Diapositivo

Subscriber
Allowing Ads
Joined
Nov 1, 2009
Messages
3,257
Location
Rome, Italy
Format
35mm
Can anybody explain to me the concept of negative density? "Density", I get that. Higher the density, darker the film layer over the base. Zero density means transparent film layer over the base. But "negative" density, how do you obtain, or measure, that?
I can't figure it in my mind, no more than I could figure "negative volume" or "negative sound".
 
OP
OP
Doc W

Doc W

Member
Allowing Ads
Joined
Nov 7, 2009
Messages
955
Location
Ottawa, Cana
Format
Large Format
Can anybody explain to me the concept of negative density? "Density", I get that. Higher the density, darker the film layer over the base. Zero density means transparent film layer over the base. But "negative" density, how do you obtain, or measure, that?
I can't figure it in my mind, no more than I could figure "negative volume" or "negative sound".

I am probably the wrong guy to answer that question, but in this graph, the values are actually positive but they are used as if they were negative. In the case of this graph, it would have been better to name the x-axis "density of the negative."

The idea of negative values for density makes no sense to me either, but it is probably how the teleporter in Star Trek worked.
 

Sirius Glass

Subscriber
Joined
Jan 18, 2007
Messages
50,717
Location
Southern California
Format
Multi Format
The X axis is logarithms and the power of each number is negative thus denoting values let than the base of the logarithms. Mathematically this makes sense, but one has to have the mathematical background to see this clearly. Forget about the why of the X-scale and concentrate on the conclusions that the book draws from the graph.
 

Bill Burk

Subscriber
Allowing Ads
Joined
Feb 9, 2010
Messages
9,455
Format
4x5 Format
This appears to me that the x-axis is marked in density.... of the step wedge which lays over the paper when you make the exposure.

So 0.00 means the whole shooting match --- all the exposure. Makes the paper black. If you are familiar with logarithms 1.0 would be 1/10th of whatever that exposure was (and exposure often is given in arbitrary terms like that), 2.0 would be 1/100th of the exposure and 3.0 would be 1/1000th
 

RobC

Member
Allowing Ads
Joined
Nov 5, 2007
Messages
3,880
Location
UK
Format
Multi Format
Actually the x-axis of a characteristic curve plot can easily end up with negative numbers growing in magnitude from right to left, depending on the units used for exposure. Remember that the x-axis is the log of exposure, not exposure. Numbers less than 1 will take on negative values of increasing magnitude when converted to logs.

Below is a link to a characteristic curve I plotted. It's for a film, but the principle is identical for paper. On the x-axis, exposure is increasing to the right and the log values of exposure (H) are becoming less negative.

(there was a url link here which no longer exists)

I believe this is what we're essentially looking at on the diagram you posted (with the negative signs omitted). That's the only possibility if the x-axis truly represents exposure as labeled on the diagram. And again, all that's important are the intervals/ranges (ie the exposure range of the paper): characteristic curves for photographic materials are typically constructed such that each log exposure interval of 0.3 on the x-axis represents a doubling or halving of exposure - ie one stop.

If on the other hand the x-axis on the diagram you posted is really supposed to show step wedge densities, then the axis is mis-labeled and should be called something like "step wedge D", not exposure.

A sensitometry primer including characteristic curves for film, paper etc.:

http://motion.kodak.com/KodakGCG/up...en_motion_education_sensitometry_workbook.pdf

In this case the x-axis is NOT the log of exposure, it is the log of film density (i.e. transparency). Not the same thing.
I know you know that but before people start mis-interpreting what you really meant, its worth pointing out the slip.
 

RobC

Member
Allowing Ads
Joined
Nov 5, 2007
Messages
3,880
Location
UK
Format
Multi Format
The X axis is logarithms and the power of each number is negative thus denoting values let than the base of the logarithms. Mathematically this makes sense, but one has to have the mathematical background to see this clearly. Forget about the why of the X-scale and concentrate on the conclusions that the book draws from the graph.

No don't forget about the x-scale. Its the x-scale that was confusing the OP in the first place and in trying to understand he asked the question.

As I just corrected Michael in previous post, when talking about PAPER curves the x-axis (in this case) is the log of film density (transparency) as taken from the negative and not the PAPER exposure. The negative densities have NOT been converted to relative paper exposure values on the x-axis in this case.

If people really can't get their head areound the simple graph then to help themselves out just flip the graph horizontally then the x-axis will magically go from left to right in ascending sequence. Or pretend you're japanese.
Flipping another graph showing something else horizonatlly which uses negative log values would not mean you use positive values.

Those numbers presented in that way should NOT be negative.
 
Last edited:

Bill Burk

Subscriber
Allowing Ads
Joined
Feb 9, 2010
Messages
9,455
Format
4x5 Format
The way I see it, everyone is right here.

I see scales all the time where exposure is on the x-axis in a relative logarithmic scale... with zero on the right and the scale not showing negative numbers.

You might think of that scale as attenuation (if I can call it that) where 0.00 is full blast and the numbers are density measurements of the step wedge that was used to make the exposure.

Now I also include in my graphs an absolute exposure scale where 0.00 is near the right and represents 1 MCS. It's not exactly at the right because the sensitometer puts a little more than 1 MCS My absolute scale is marked with negative logarithms, calculator style. Real mathematicians use bar-mantissa notation which I think they use to prove they're smarter than us lumberjacks. But calculator style negative logarithms are a whole lot easier to grasp. They look just like density numbers but with negative signs.

So I have two different scales with logarithmic markings, one at the bottom without negative numbers starting out right at zero. It represents the step wedge densities in the test platen. And the other one positioned over to the left a little bit marked in negative numbers for the Log MCS.


tmxgraph.jpg
 

RobC

Member
Allowing Ads
Joined
Nov 5, 2007
Messages
3,880
Location
UK
Format
Multi Format
the numbers are only negative because the actual resolved values are less than 1. When printing paper the exposure values are normally all greater than 1. So any argument that the numbers should be negative becasue its a certain type of log value is garbage. They are negative becasue film happens to have exposure values ranging from 1 to 10,000th of a second. i.e. all less than 1 and not some some inherant rule about the type of graph.
Paper exposure normally run 1 second up so will all be positive values.

And for those who still haven't got it, I suppose you're not good with logarithms. Well for our photographic purposes they are all base 10 and to resolve them to actual decimal values you use the log value as the exponent of 10. i.e. you raise 10 to the power of the log value.

So

10^-3 = 1/1000
10^3 = 1000

but the film densities are not actual exposure values in seconds anyway. They are purely relative densities and the lower the density the higher the exposure value so you can't convert them to seconds directly by using 10^density. You can howver convert them to a fraction of exposure because 10^1.7 = 50.1187 which is the speed point from the graph and means the speed point receives 1/50th of the light that density 0 receives which is 5 2/3 stops less light and not a seconds of exposure value.
If the exposure was 20 seconds then 1/50th of it would be 0.4 seconds (actually 0.425 seconds if being really accurate).

So to me the graph makes perfect sense but I won't deny I had to think about it a bit when I read the book years ago.

AND

You might say that 1/50 is less than 1 so should be negative but film tranparency is actually measured in percentage transmission so 1/50 converted to a percenatge is 2% and percentages are always measured in positive values as far as I'm aware.
 
Last edited:

markbarendt

Member
Allowing Ads
Joined
May 18, 2008
Messages
9,422
Location
Beaverton, OR
Format
Multi Format
Added some tables to the curve and the red line is one possibility of how the negative curve might fall across the paper curve.

Screen Shot 2016-03-05 at 6.39.22 AM.png
 

Attachments

  • print curve-001.pdf
    58.4 KB · Views: 238
Last edited:

Diapositivo

Subscriber
Allowing Ads
Joined
Nov 1, 2009
Messages
3,257
Location
Rome, Italy
Format
35mm
Maybe the negative numbers at the horizontal axis are due to the fact that, years ago, the unit for exposure was not millilux - second, but lux - second.

The thing is explained at page 17 of the Kodak sensitometry Workbook (November 2006 - H-740).

Characteristics in this context means the whole number part of the exponent of a logarithm.

<<
Negative characteristics are used quite often in
sensitometry. Note that in this book the unit for exposure
is millilux-seconds. The former standard unit was
lux-seconds. Five hundred millilux-seconds equals 0.5
lux-seconds. The log of 500 millilux-seconds is 2.7 but the
log of 0.5 lux-seconds is a negative number (-1.7). All
characteristic curves that used lux-seconds as the unit for
exposure use negative characteristics.
Be prepared for this when looking at most characteristic
curves because the change to using millilux-seconds is
fairly recent and most published curves use lux-seconds as
the unit for exposure.
>>


Exposure is "negative" because the exponent of a logarithm for film exposure always expresses a number < 1, when the unit of measure is lux - second instead of millilux - second.

I don't feel very compfy with logarithms so you do the math and tell me whether this is a reasonable explation of the way the originally posted graph is constructed.
 

RobC

Member
Allowing Ads
Joined
Nov 5, 2007
Messages
3,880
Location
UK
Format
Multi Format
the chart is not showing exposure time to produce negative density and exposure times vary so stop quoting what you find relating to negative development.
The chart is showing negative density producing print density for a single exposure time. i.e. completely different so you should not keep quoting what you find about negative development.
 

markbarendt

Member
Allowing Ads
Joined
May 18, 2008
Messages
9,422
Location
Beaverton, OR
Format
Multi Format
the chart is not showing exposure time to produce negative density and exposure times vary so stop quoting what you find relating to negative development.
The chart is showing negative density producing print density for a single exposure time. i.e. completely different so you should not keep quoting what you find about negative development.

I'm having a real struggle trying to see what you are saying. You're the only one that has talked about exposure time or negative development, and just in this post.

The graph the OP presented is representing a paper's curve, the Y axis correctly shows silver density rising from 0 (none) to max black (more than none). This axis is easy to understand.

The X axis is trying to show the amount of print exposure required. Print white is farthest left from 0, print black is closet to zero. Print black (scene shadows) takes more paper exposure to create than print white (scene highlights) so the scale has to be showing less print exposure to the left. The labeling on the scale is therefore showing negative numbers, no fancy maths rules required.

In the real world exposure can't be negative, there is only none or more than none, so mathematically the 0 point the author chose is both arbitrary and relative hence the numbers on the X axis scale can't represent real exposure values directly. The only way to translate the numbers on the scale to real numbers (measured amounts of light) is if we know what "real world" value the 0 on the scale actually equals and then do some math.
 
Last edited:

Photo Engineer

Subscriber
Allowing Ads
Joined
Apr 19, 2005
Messages
29,018
Location
Rochester, NY
Format
Multi Format
Here are two graphs.

The first is a set of print, paper and film curves used to examine Kodak films for conformance to release specifications. Positives are plotted with Dmax on the left, and negatives with Dmax on the right.

The second example is a blank sheet of the paper used for this type of work.

PE
 

Attachments

  • film-paper-print curves.jpg
    film-paper-print curves.jpg
    157.2 KB · Views: 202
  • sensvertical4.bmp
    116.3 KB · Views: 151

RobC

Member
Allowing Ads
Joined
Nov 5, 2007
Messages
3,880
Location
UK
Format
Multi Format
for those still struggling with it I have converted the values to film transmission %age in RED. Now see they are nicely ascending values but I expect they are even lesss meaningful to you all since they are not log values, but they are what is really happening.


print curve-001.jpg
 
Last edited:

Sirius Glass

Subscriber
Joined
Jan 18, 2007
Messages
50,717
Location
Southern California
Format
Multi Format
Smooth move RobC. That should help those who do not understand logarithms.
 
Photrio.com contains affiliate links to products. We may receive a commission for purchases made through these links.
To read our full affiliate disclosure statement please click Here.

PHOTRIO PARTNERS EQUALLY FUNDING OUR COMMUNITY:


Ilford ADOX Freestyle Photographic Stearman Press Weldon Color Lab Blue Moon Camera & Machine
Top Bottom