Positives are plotted with Dmax on the left, and negatives with Dmax on the right.
Much less confusing system


Positives are plotted with Dmax on the left, and negatives with Dmax on the right.
Characteristics in this context means the whole number part of the exponent of a logarithm.
...
I don't feel very comfy with logarithms so you do the math and tell me whether this is a reasonable explanation of the way the originally posted graph is constructed.
for those still struggling with it I have converted the values to film transmission %age in RED. Now see they are nicely ascending values but I expect they are even lesss meaningful to you all since they are not log values, but they are what is really happening.
Yeah the bar over the characteristic means it is negative... and the mantissa is the other part of the number and remains positive... That old notation was useful in the days of slide rules and logarithm charts. But it will make you mad. Today I only use that when I have to, like when looking at historic charts where they were used. Working with those numbers is difficult and confusing.
I recommend using the calculator to convert arithmetic numbers that represent exposure to base 10 Logarithms. After calculating the total you are looking for you can use the antilog function to get the arithmetic number back to double check. That's fun for finding out how many foot candles were figured for sunny 16.
A calculator makes quick work. You can take an arithmetic number and convert to logarithm easily and if you push the wrong buttons on the calculator you will get an error or a number that doesn't make any sense with what you are trying to do.
The density of a photographic material is usually given in logarithmic terms (the definition is certainly round-about but gives us numbers such as 0.0 is clear film, 1.0 lets 10% of the light through 2.0 lets 1% through and 3.0 lets a tenth of a percent of the light through.) Transparency isn't a bad way to think about it, but the measure is how transparent it is not.
When you have a handful of logarithmic values you can add or subtract them. That's how you can easily take two 0.3 ND filters on top of each other, get 0.60 and know that the exposure compensation is two stops.
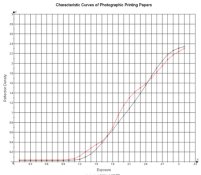
Again, I assert everyone is right here. Although the original chart is not a "tone reproduction" chart... it is a paper characteristic curve... the x-axis is exposure.
The x-axis is indicated with positive logarithmic numbers. I assert that this indicates the numbers of the densities of the step wedge placed on top of the film when making the test exposure. The base exposure is 1 mathematic, 0.0 logarithmic. Starting on the right and working backwards by 0.1 marks you get a step labeled 0.3 and I assert that is the base exposure reduced by being covered with a piece of film with an 0.3 density.
The negative sign could just as well have been put in front of each of these numbers on that original chart, for example -0.3 would clarify that the exposure is a base exposure minus 0.3 density. The paper received -0.3 exposure.
While exposures can't be "negative", the logarithm of an exposure, which reflects an exponent, can be negative. -2.0 is not a negative exposure, it is ten to the minus two, or one-one-hundredth of the base exposure.
the chart is not showing exposure time to produce negative density and exposure times vary so stop quoting what you find relating to negative development.
The chart is showing negative density producing print density for a single exposure time. i.e. completely different so you should not keep quoting what you find about negative development.

...You need to convert using the adjustment from 0 (or 100% tansmission) on the right using the usual each 0.3 log units equals one stop of exposure so that 1.5 on the x axis means 5 stops less exposure than 100% (or 5 stops difference from 0). If you just remember that each 0.3 log units of density equals 1 stop and each 0.1 units of log density equals 1/3 of a stop you don't need to think about logarithms apart from that very simple shortcut...
The graph published is not meaningless if on understands log values, and exposure. There is no universal 'conversion factor' to go from exposure to transmission. Read up on logs. Values less than unity are negative.
I agree.You misunderstand my point. It is not that the graph is meaningless but that the specific numeric values are meaningless. They do nothing to explain the graph and only confuse the reader. It would be better to just use relative adjectives such as greater or lesser. This what most texts on photography do.
What is important is the general shape of the curve (which is the same I might add for both film and paper). That is why it is called the Characteristic Curve. So unless one is speaking about a particular film or paper the actual numbers are meaningless.
What is of interest is that the curve eventually turns downward. You can just see this by looking closely. This is what permits "development to completion" to work. But that is another story which I mention only because there are good illustrations for this thread.
The graph published is not meaningless if on understands log values, and exposure. There is no universal 'conversion factor' to go from exposure to transmission. Read up on logs. Values less than unity are negative.
You misunderstand my point. It is not that the graph is meaningless but that the specific numeric values are meaningless. They do nothing to explain the graph and only confuse the reader. It would be better to just use relative adjectives such as greater or lesser. This what most texts on photography do.
I agree.
actually ,step wedge densities can be seen as exposure for the print.Actually the x-axis of a characteristic curve plot can easily end up with negative numbers growing in magnitude from right to left, depending on the units used for exposure. Remember that the x-axis is the log of exposure, not exposure. Numbers less than 1 will take on negative values of increasing magnitude when converted to logs.
Below is a link to a characteristic curve I plotted. It's for a film, but the principle is identical for paper. On the x-axis, exposure is increasing to the right and the log values of exposure (H) are becoming less negative.
(there was a url link here which no longer exists)
I believe this is what we're essentially looking at on the diagram you posted (with the negative signs omitted). That's the only possibility if the x-axis truly represents exposure as labeled on the diagram. And again, all that's important are the intervals/ranges (ie the exposure range of the paper): characteristic curves for photographic materials are typically constructed such that each log exposure interval of 0.3 on the x-axis represents a doubling or halving of exposure - ie one stop.
If on the other hand the x-axis on the diagram you posted is really supposed to show step wedge densities, then the axis is mis-labeled and should be called something like "step wedge D", not exposure.
A sensitometry primer including characteristic curves for film, paper etc.:
http://motion.kodak.com/KodakGCG/up...en_motion_education_sensitometry_workbook.pdf
| Photrio.com contains affiliate links to products. We may receive a commission for purchases made through these links. To read our full affiliate disclosure statement please click Here. |
PHOTRIO PARTNERS EQUALLY FUNDING OUR COMMUNITY:  |