• Welcome to Photrio!
    Registration is fast and free. Join today to unlock search, see fewer ads, and access all forum features.
    Click here to sign up

The "Perceptual" approche - a new Digital Negative method

Recent Classifieds

Forum statistics

Threads
201,108
Messages
2,819,279
Members
100,530
Latest member
Rebalance
Recent bookmarks
0

nmp

Member
Allowing Ads
Joined
Jan 20, 2005
Messages
2,057
Location
Maryland USA
Format
35mm
hi niranjan
centenial POP hasn't been available for over a decade ..
im a bit confused ... are you editing a scan so it looks like contact printed image
or editing a scan and inverting it, to create a film ( or paper ) negative to be contact printed
on an alternative process ( i use alternative to include contact printing on silver papers as well ).
sorry for my confusion ...
Hi, John:

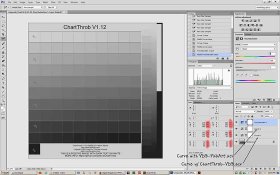
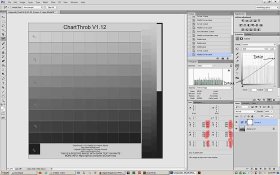
If it is confusing, the fault is mine. Here is background on what I did:

I had a box of Centennial POP from way back that I had left unopened in the fridge all this time. Luckily I found that the contents were still good so I decided to develop the contact printing process for it, using digital negatives. The image that I am showing in Figures 1 thru 3 is an old (really) Kodachrome slide of mine that I scanned and converted to B&W in Photoshop. The scanned unedited image that you see in Figure 4 is the result of printing this image on Centennial POP toned with selenium.

:Niranjan.
 

Bob Carnie

Subscriber
Allowing Ads
Joined
Apr 18, 2004
Messages
7,735
Location
toronto
Format
Med. Format RF
When my Lambda balances the lasers to create a linearized 21 step wedge I am confident that when I lay down a density it will be recorded as that density.

I then have to think about the process density and contrast implications... and I think this is where the Perceptual thinking is great. I will make a print from the step wedge the Lambda creates and make a first test print on any process to get a starting balance
Then I will do the following to manipulate my negative further.
In my case I will create a canvas and make 10 duplicate files of the same image, I will then rename each file and apply a repeatable curve adjustment to each.. much like a Ring Around . I will use an image that I know how it is to look like and contact this CANVAS on paper and test balance.

Once the print is dry I will evaluate the 10 different files and evaluate which one I actually feel prints the best for the process of choice and that will be the curve I apply after editing in Photoshop to send to my Lambda.

So Perceptually I have my eyeballs do the final touch, but I do use the onboard densitomiter to make sure the printer is laying down Known L density values...

In Inkjet one needs to do this Profile or curve first to get the Epson and film in good position , then adjusting to process is easy and I would use a Ring Around Approach.

If you ask a long time Pt Pd Worker how they manipulate film to contrast you will find out that some initial testing to find the balance was indeed needed.... If it walks like a duck(neg) quacks like a duck(neg) then it probably is a duck(neg)
 

removed account4

Subscriber
Allowing Ads
Joined
Jun 21, 2003
Messages
29,832
Format
Hybrid
ahhh, makes perfect sense now !
thanks for helping me understand ..
so you made a digital likeness and inverted it
and contact printed THAT as your negative .. looks like it worked very well ! :smile:
 

nmp

Member
Allowing Ads
Joined
Jan 20, 2005
Messages
2,057
Location
Maryland USA
Format
35mm
You can do the test on your own images. You can download the "VDB-FabArt.acv" here: https://drive.google.com/open?id=0B4dENtC-VAIheGtBS0FmRlRSTFk

Thanks, Dan for sharing this. I downloaded it although I do have one just like that for my POP process. Will delve in more detail when I get some more time. For now as I understand your approach, I see that what I am doing is is a simplified subset of yours. I will elaborate later....

:Niranjan.
 

nmp

Member
Allowing Ads
Joined
Jan 20, 2005
Messages
2,057
Location
Maryland USA
Format
35mm
ahhh, makes perfect sense now !
thanks for helping me understand ..
so you made a digital likeness and inverted it
and contact printed THAT as your negative .. looks like it worked very well ! :smile:
Thanks...I call this the mother of all hybrid processes...:D
 

faberryman

Subscriber
Allowing Ads
Joined
Jun 4, 2016
Messages
6,048
Location
Wherever
Format
Multi Format
If that is the case, then I see the calibration process as like the zone system where you tailor the negative to fit the paper through N- and N+ development (scientific vs perceptual).I don't recaull anyone describing any such compression/expansion as resulting in dull and lifeless prints. I'd be interested in learning more about your "perceptual" approach though. Whose perception? I control contrast with my PtPd prints both in how I tweak the digital negative on screen in LR/PS (is this what you call the perceptual approach?) and with Na2. The calibration process where you linearize the transitions from dark to light is designed to help translate what you see on the screen (linear) to what you see in the print. How do you perceptually calibrate your monitor so that what you seen on-screen matches your perceptually modified DN and thus print.
 

Richard Boutwell

Member
Allowing Ads
Joined
Jul 21, 2003
Messages
583
Location
Philadelphia
Format
8x10 Format
It sounds like you are trying to make the equivalent of an ICC profile by using a scanner and curves adjustment layer. This is essentially a soft proofing step, correct? You get a preview how your image will look with that process and apply an adjustment to get it to look the way you intend it to. If you make an ICC profile from a linearized 21-step target you can do the same thing. The qtr-stepwedge tool can get the lab cakes from a scanned image and then just make an ICC profile with the qtr-create-ICC-RGB script.

I get what you are going for, but I think the audio analogy might not be the best way to describe it. The whole problem is trying to get the larger scale from the digital file to appear correct when printed with a compressed tonal range (for ptpd L* 97- L* 24) is the way the linear Lab L* gives you th appearance of weak blacks and 3/4 tones. Getting those tones to appear correct is basically the whole point of black point compensation. I built a correction for that into my digital negative
linearization systems that export corrected quad curves so there is no additional curves adjustment to make is Photoshop at all.
 
OP
OP
Dan Pavel

Dan Pavel

Member
Joined
Sep 11, 2017
Messages
245
Location
Constanta, Romania
Format
Multi Format
It sounds like you are trying to make the equivalent of an ICC profile by using a scanner and curves adjustment layer. This is essentially a soft proofing step, correct?
Yes. that's right.
My intention is to make a PS script (similar with ChartThrob) that will create 2 curves, one (3 channel) for soft proofing by curves-layer and one for Calibration (like the ChartThrob curve but a bit smooth). This second curve is just a starting point in producing the DN - you can add any other adjustment you need while seeing the outcome. Then I'll integrate them in a logical Layers groups layout with all the adjustment layers needed to print the final DN (I already did this).
I am sure that this can be done in other ways, too (and probably better) but my intention was to keep it as simple, intuitive and user-friendly as possible.
Now I am making the first of the two curves by manual input of data but I start working on the PS script. My programming skills are limited and it will take a while to complete the work (if ever...).

I started to use this approach in making DNs because of 3 reasons.
-The output of the traditional approach needed further corrections in PS. Making a standard correction set and applying it to all the prints didn't work for me. Different images needed different corrections, as can be seen in my 2 examples posted. It looked like the process of making a DN was, at least partially, image-depended. Sometimes even local adjustments were needed in the final print even they were not obvious in the initial image. Relying only on a repetitive layout proved not to be a viable option, at least for me. I've tried to find a way to solve this.
-The traditional approche (ex. ChartThrob) involves testing on paper any additional adjustment I made - waste of time and materials. So, why not to instantly see the effect of this adjustments?
-IMO making images with the alternative processes is a form of art and to rely more on my eyes than on an automated procedure in this process makes, for me at least, more sense.

Of course, this approach may not fit others' habits but it works very well for me.
 
Last edited:
OP
OP
Dan Pavel

Dan Pavel

Member
Joined
Sep 11, 2017
Messages
245
Location
Constanta, Romania
Format
Multi Format
Sometimes even local adjustments were needed in the final print even they were not obvious in the initial image.
I'll try to be a bit more specific on that.
Let's take my second test example. It's a 5min, imperfect adjustment, only made to support my point.
But, while trying to adjust the ChartThrob output to be more realistic overall some zones of the image degraded and become, in fact, less realistic. The outlined one is the most obvious of them. IMO, If I was to print the image a local adjustment on that zone would be certainly required.
Compared2.jpg
 
Last edited:

nmp

Member
Allowing Ads
Joined
Jan 20, 2005
Messages
2,057
Location
Maryland USA
Format
35mm
Because it's true that "A picture is worth a thousand words" I did a little test.
An Alternative Process/paper combination can be simulated in PS by a curve. I simulated VDB on Fabriano Artistico with a curve saved as "VDB-FabArt.acv" (I already had it om my HD). It simulates a print made with a DN with no correction applied,
Applying this curve to an image will simulate a VDB print on the Fabriano Artistico paper. The simulated print is an ideal print, with no variable induced by the scaner, chemicals, temperature, etc.
Let's take an image and apply the curve to it. The result will simulate a VDB print with no correction applied to the DN.
....
You can do the test on your own images and with your own calibration tool. You can download the "VDB-FabArt.acv" here: https://drive.google.com/open?id=0B4dENtC-VAIheGtBS0FmRlRSTFk

Dan:

I wanted to make sure I understand how you made the VDB-FabArt.acv curve. Is it the potting of the image values of the step wedge as input and the print values of the step wedge as output on the Curves layer in Photoshop?

Yes?

:Niranjan
 
OP
OP
Dan Pavel

Dan Pavel

Member
Joined
Sep 11, 2017
Messages
245
Location
Constanta, Romania
Format
Multi Format
Yes Niranjan, but separately for the R, G and B channels, of course. I made a 16 steps step wedge for that because only 16 values can be set manually. I use the "Show Amount of Light" (0-255) as the display option. I don't use a Curves layer for that, I use the Image-Adjustments-Curves method because it's easier to add points in curves this way.
 

Richard Boutwell

Member
Allowing Ads
Joined
Jul 21, 2003
Messages
583
Location
Philadelphia
Format
8x10 Format
Yes Niranjan, but separately for the R, G and B channels, of course. I made a 16 steps step wedge for that because only 16 values can be set manually.

I bet this could be done easier with a color lookup table like the one I made with excel early this year. It has the possibility of using any number of steps. I’m only did it based on the L* values, but I could modify it to take Lab values and adjust the color of the print as well. Here is a link to the lookup table exc l tool: Dead Link Removed
 

nmp

Member
Allowing Ads
Joined
Jan 20, 2005
Messages
2,057
Location
Maryland USA
Format
35mm
Yes Niranjan, but separately for the R, G and B channels, of course. I made a 16 steps step wedge for that because only 16 values can be set manually. I use the "Show Amount of Light" (0-255) as the display option. I don't use a Curves layer for that, I use the Image-Adjustments-Curves method because it's easier to add points in curves this way.
Thanks....so how is it easier that way - are able to do this in a table or something. I vaguely remember there was such a capability but I can't find it anymore so I use the conventional way which, you are right, is cumbersome for points that are very close. I also made myself a simple 16 point chart thinking the same thing about the limitation of Photoshop.

So far it looks like our approaches are fairly similar if not identical in some respects. I will demonstrate that later.

:Niranjan.
 

nmp

Member
Allowing Ads
Joined
Jan 20, 2005
Messages
2,057
Location
Maryland USA
Format
35mm
I bet this could be done easier with a color lookup table like the one I made with excel early this year. It has the possibility of using any number of steps. I’m only did it based on the L* values, but I could modify it to take Lab values and adjust the color of the print as well. Here is a link to the lookup table exc l tool: Dead Link Removed

I did a lot of Excel work filling in 101 points from ChartThrob manually and plotting various curves. The problem is you have to plug the numbers back into Photoshop to get the negative. So it will have the same issue, no?
 
OP
OP
Dan Pavel

Dan Pavel

Member
Joined
Sep 11, 2017
Messages
245
Location
Constanta, Romania
Format
Multi Format
Niranjan, another problem is where you measure the values on the scan with the eyedropper. IMO, the best method to get the average values is to copy a square inside a step, create new document, paste it, resize it to 1px, resize it back to the initial size and measure inside. I know its time-consuming but it ensures you have the exact average values. The blur method is not precise and I don't know another precise method in PS. It would be nice to find a simpler way...How you do that?
Thanks....so how is it easier that way
The dialog window is bigger :smile:
 
Last edited:

Richard Boutwell

Member
Allowing Ads
Joined
Jul 21, 2003
Messages
583
Location
Philadelphia
Format
8x10 Format
I did a lot of Excel work filling in 101 points from ChartThrob manually and plotting various curves. The problem is you have to plug the numbers back into Photoshop to get the negative. So it will have the same issue, no?

If you have a scanning chart reader you can just paste the numbers into excel. The functions I created does the smoothing and correction, and then generates the LUT as a text file with a .cube extension that you just load it in PS. The benefit of the LUT is that you can generate a true 16-bit value rather than an 8-bit.

Your sampling method seems tedious, and with proper smoothing, you should be able to do just fine with the average blur inside a selection. Tat is usually enough to average the paper texture and the actual tonal value.
 

nmp

Member
Allowing Ads
Joined
Jan 20, 2005
Messages
2,057
Location
Maryland USA
Format
35mm
Niranjan, another problem is where you measure the values on the scan with the eyedropper. IMO, the best method to get the average values is to copy a square inside a step, create new document, paste it, resize it to 1px, resize it back to the initial size and measure inside. I know its time-consuming but it ensures you have the exact average values. The blur method is not precise and I don't know another precise method in PS. It would be nice to find a simpler way...

I don't do blurring. I simply use the rectangular marquee tool to define as much of the block as possible and use the data underneath the histogram that gives you the "mean value" in RGB of all pixels sampled within the selection. If I have a significant defect somewhere in the block, I make sure to lasso it out. I does not give you the three channels separately, though.
 

nmp

Member
Allowing Ads
Joined
Jan 20, 2005
Messages
2,057
Location
Maryland USA
Format
35mm
If you have a scanning chart reader you can just paste the numbers into excel. The functions I created does the smoothing and correction, and then generates the LUT as a text file with a .cube extension that you just load it in PS. The benefit of the LUT is that you can generate a true 16-bit value rather than an 8-bit.

Your sampling method seems tedious, and with proper smoothing, you should be able to do just fine with the average blur inside a selection. Tat is usually enough to average the paper texture and the actual tonal value.

I don't have one of those readers. But I did just get myself a ColorMunki Photo that does something like this when you make a printer icc profile, although it does all the calculations internally. Wonder if there is an external software that will spit out those numbers to a file. Lot to learn.
 
OP
OP
Dan Pavel

Dan Pavel

Member
Joined
Sep 11, 2017
Messages
245
Location
Constanta, Romania
Format
Multi Format
Your sampling method seems tedious, and with proper smoothing, you should be able to do just fine with the average blur inside a selection. Tat is usually enough to average the paper texture and the actual tonal value.
Indeed it is. I've played a little with PS Actions and it can be saved as an Action for the entire step wadge. It's much easier this way.
 

nmp

Member
Allowing Ads
Joined
Jan 20, 2005
Messages
2,057
Location
Maryland USA
Format
35mm
I don't do blurring. I simply use the rectangular marquee tool to define as much of the block as possible and use the data underneath the histogram that gives you the "mean value" in RGB of all pixels sampled within the selection. If I have a significant defect somewhere in the block, I make sure to lasso it out. I does not give you the three channels separately, though.

Oops, I was wrong. You CAN get mean values of each of the R, G, and B channels by cycling through them in the histogram drop down...
 

nmp

Member
Allowing Ads
Joined
Jan 20, 2005
Messages
2,057
Location
Maryland USA
Format
35mm
Dan:

Use of all color channels is one difference between our approaches. For sake of simplicity, I de-saturate my scanner image so each channel is same before cranking through the ChartThrob script. I have not seen a big difference between ChartThrob ouput curves from as is scan and a de-saturated one. I would think this approximation is fine as long as the relationship between the 3 colors is somewhat consistent with respect to the exposure. Of course, this would be dependent on the type of the process and whether or not some funky split-toning is going on. The disadvantage of working in the de-saturation mode is that the simulation does not look so life-like with the nice hues of an alternative process print.

ChartThrob Calibration/Simulation:

The Dmax and Dmin, as represented by RGB values can be calculated by applying the VDB-FabArt.acv curve on a ChartThrob stepwedge, destaurating and measuring the value at 0 and 100% B levels respectively. From that Dmax=31 and Dmin=206 for your VDB process.

(I have been taking the liberty in terminology here and using the classical D terms that are usually density measurements, not 8-bit RGB values.)

I created and saved the ChartThrob-VDB.acv as suggested by running the ChartThrob script on the step wedge on which the VDB-FabArt.acv was applied. Then I took the step-wedge and successively applied the ChartThrob-VDB.acv and VDB-FabArt.acv and de-staurated the data next by using H/S layer and moving the saturation to 0. 6 readings on the step wedge for 0, 20, 40, 60, 80 and 100%B changed as follows (See Figure 5):

%B/RGB Original/RGB after two curve layers and de-saturation

0/255/206
20/204/170
40/153/136
60/103/103
80/53/65
100/0/31

These reading are nearly identical to those created by simply applying a straight line curve (oxymoron) between (0, 31) and (255,206) (see Figure 6):

%B/RGB Original/RGB after straight line curve

0/255/206
20/204/171
40/153/136
60/103/102
80/53/67
100/0/31

This is same as my simulation with what I called the “characteristic curve” on Figure 2 of Post #20. One can also use analytical calculations to arrive at the same point instead of above empirical one.

The Perceptual approach.

Here what you are doing is do away with the middleman – the ChartThrob correction curve - and simply simulating the final outcome or soft-proofing (probably a better term as suggested by Richard Boutwell) on-the-go. This could be a challenging step, specially for a brand new process. You do suggest using the ChartThrob curve as a starting point. But the good thing is the ChartThrob curve does not have to be perfect, only that the VDB-FabArt.acv has to be an accurate representation of the process. Then use any kind of adjustment layer(s) to get the desired perceptual look. This is more generalized approach than mine where I narrowed it so-far to a simple curve to put a little bit of punch in the print.


That's my analysis in a nut-shell....

Comments?

:Niranjan.
 

Attachments

  • Figure 5.jpg
    Figure 5.jpg
    59.3 KB · Views: 140
  • Figure 6.jpg
    Figure 6.jpg
    56.8 KB · Views: 125
Last edited:
OP
OP
Dan Pavel

Dan Pavel

Member
Joined
Sep 11, 2017
Messages
245
Location
Constanta, Romania
Format
Multi Format
Yes Niranjan, your analysis are correct. It's amazing how we both followed the same path up to a point.
With a small addition: not only that the ChartThrob curve does not have to be perfect in my approach - it is better for it not to be so steep (let's say 5%-10% closer to the diagonal than the normal ChartThrob generated curve). That's to avoid, as possible, double-correcting with the rest of the adjustments, which is prone to generate degraded zones due to the integer rounding in the PS calculations. A 16 bits/channel RGB mode is a must, anyway.
The soft-proofing curve (VDB-FabArt.acv in my example) will be as accurate as the calibration of the system (monitor, printer, scaner) and the repeatability of the wet process is. But that's the case with all the existing DN calibration procedures - it's unavoidable.

The plus of my approach is, IMO, that better, more realistic result can be easier obtained than with a traditional DN calibration method and you have more control of the output. That's what I tried to prove with my example test. It's an ideal test where all the calibrations are perfect and the wet process is perfectly repetabile (the exact values in the VDB-FabArt.acv curve are irelevant - any curve could be used instead). Therefor all the differences in the output reflect strictly the differences between the capabilities of the 2 approaches.
 
Last edited:
Photrio.com contains affiliate links to products. We may receive a commission for purchases made through these links.
To read our full affiliate disclosure statement please click Here.

PHOTRIO PARTNERS EQUALLY FUNDING OUR COMMUNITY:


Ilford ADOX Freestyle Photographic Stearman Press Weldon Color Lab Blue Moon Camera & Machine
Top Bottom