Quantifying Exposure

There there

A
There there

  • 3
  • 0
  • 32
Camel Rock

A
Camel Rock

  • 7
  • 0
  • 147
Wattle Creek Station

A
Wattle Creek Station

  • 9
  • 2
  • 138
Cole Run Falls

A
Cole Run Falls

  • 3
  • 2
  • 113

Forum statistics

Threads
198,958
Messages
2,783,784
Members
99,758
Latest member
Ryanearlek
Recent bookmarks
0

Bill Burk

Subscriber
Joined
Feb 9, 2010
Messages
9,316
Format
4x5 Format
A-ha, I'm aiming using the chart you gave me. Ansel Adams is aiming using Zone VIII. The top of 7 1/3 stop (my Normal) is less than 8. So it makes sense that if you stick to using Zone System to decide a NDR you would choose a higher density aim, than if you were aiming based on another system where 7 1/3 stops is Normal.
 
OP
OP
Stephen Benskin
Joined
Jan 7, 2005
Messages
2,615
Location
Los Angeles
Format
4x5 Format
7 1/3 is larger than 7, so shouldn't 7 1/3 have a larger NDR? Just to be clear, this is not just a simple case of different methodolgies. The paper LER is the basic method to determine the aim negative density range for a paper. A NDR of 1.25 simply will not fit on a LER 1.05. The only possible explanation as to why the Zone System 1.25 target density range determined from testing is able to print on a grade 2 paper with a LER of 1.05 is because of the addition of flare (which is not factored in with the testing) in normal shooting conditions. Remember in camera Zone System testing has minimum to zero flare.
 

Bill Burk

Subscriber
Joined
Feb 9, 2010
Messages
9,316
Format
4x5 Format
7 1/3 is larger than 7, so shouldn't 7 1/3 have a larger NDR? Just to be clear, this is not just a simple case of different methodolgies. The paper LER is the basic method to determine the aim negative density range for a paper. A NDR of 1.25 simply will not fit on a LER 1.05. The only possible explanation as to why the Zone System 1.25 target density range determined from testing is able to print on a grade 2 paper with a LER of 1.05 is because of the addition of flare (which is not factored in with the testing) in normal shooting conditions. Remember in camera Zone System testing has minimum to zero flare.

Oh I got the counting of "towels and clothespins" wrong. They're both essentially 7 stops for normal, let's make them both 7 and ignore the 1/3 until reason forces us to hunt that down. The sheet you gave me highlights 7 stops for normal.

On the next page of The Negative, Adams mentioned the tendency of manufacturers to make papers a bit "shorter scale" for Grade 2 (so you better test for yourself), he also qualified his numbers as being what works for him. And many photographers are using variable contrast paper (which makes it less important to get it right).

But here's where the flare is: The enlarger lens.
 
OP
OP
Stephen Benskin
Joined
Jan 7, 2005
Messages
2,615
Location
Los Angeles
Format
4x5 Format
Oh I got the counting of "towels and clothespins" wrong. They're both essentially 7 stops for normal, let's make them both 7 and ignore the 1/3 until reason forces us to hunt that down. The sheet you gave me highlights 7 stops for normal.

On the next page of The Negative, Adams mentioned the tendency of manufacturers to make papers a bit "shorter scale" for Grade 2 (so you better test for yourself), he also qualified his numbers as being what works for him. And many photographers are using variable contrast paper (which makes it less important to get it right).

But here's where the flare is: The enlarger lens.

The reason it works for him is camera flare. The Zone System exists in the same reality as tone reproduction. Yes there is some enlarger flare and it also varies depending on the density distribution of the negative. The Callier coefficient for diffusion enlargers compensates for much of it and condenser enlargers more than compensate. Where did you think the numbers from that chart came from. The question isn't about if it works or not but to how it works or should work. How does it all fit together. We do that by first understanding the standard model based on statistical averages. Once that is understood, variations from the norm can then be added.

The shorter scale comment of Adams' is meaningless with testing. LER is what defines the paper contrast and not the grade designation. Besides we are discussing theory here. BTW, my paper curves are derived from enlarging the step tablet in a diffusion enlarger in order to incorporate some flare.

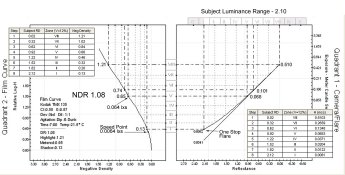
2 Quad - Exposure example - Zone - Flare.jpg

In the example, the 1.25 density range from a no flare situation (like a film curve), becomes 1.08 with the addition of one stop flare. Notice the shadow exposure increases from 0.0041 lxs (which is below the aim 0.0064 lxs for a 125 speed film) to 0.0082 lxs which is slightly over it. The metered exposure is at 0.068 as the result of the slight bit of flare at the mid point.

How does this then relate to the print LER?

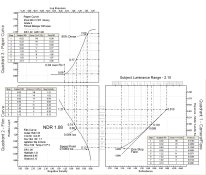
3 Quad - Exposure example - Zone - Flare.jpg

Check out the print density for Zone V. It's pretty close to 18% gray, yet the reflectance of the subject Zone V is 12%. What are the implications?
 
Last edited by a moderator:

Bill Burk

Subscriber
Joined
Feb 9, 2010
Messages
9,316
Format
4x5 Format
So you've put a little flare into the paper curve by enlarging? That's going to help, so you don't have to make a stepping stone diagram that goes up over and down to accommodate more transfers - your fourth quadrant should arrive at the preferred tone reproduction curve.
 
OP
OP
Stephen Benskin
Joined
Jan 7, 2005
Messages
2,615
Location
Los Angeles
Format
4x5 Format
So you've put a little flare into the paper curve by enlarging? That's going to help, so you don't have to make a stepping stone diagram that goes up over and down to accommodate more transfers - your fourth quadrant should arrive at the preferred tone reproduction curve.

Bill, interpreting the reproduction curve has to do with subjective tone reproduction , and those types of discussions don't go well, but to briefly sum up some of the factors involved in calculating exposure.

The image illuminance comes from the incident exposure meter calibration equation.

A^2 / T = E*S / C

Where
E = incident light, in footcandles
S = film speed
C = Exposure constant
A = f/number

A^2 / (A*S) * C = E -------- (16^2 / (1/125) * 125) * 30 = 7680 footcandles


Average reflectance in the reflection exposure meter.

R = L / I

Where
R = Reflectance
L = Luminance
I = Illuminance

The exposure constants for reflected and incident exposure meters can be substituted for the actual L and I values.

R = K * pi/ C ------- 1.16 * pi / 30 = 0.121 12%

Exposure for Lg (average luminance).

q * L / A^2 = E ---------- 0.65 * 297*10.76 / A^2 = 8.11 ---------- 8*1/125 = 0.064 lxs
 
Photrio.com contains affiliate links to products. We may receive a commission for purchases made through these links.
To read our full affiliate disclosure statement please click Here.

PHOTRIO PARTNERS EQUALLY FUNDING OUR COMMUNITY:


Ilford ADOX Freestyle Photographic Stearman Press Weldon Color Lab Blue Moon Camera & Machine
Top Bottom