Quantifying Exposure

There there

A
There there

  • 3
  • 0
  • 32
Camel Rock

A
Camel Rock

  • 7
  • 0
  • 147
Wattle Creek Station

A
Wattle Creek Station

  • 9
  • 2
  • 138
Cole Run Falls

A
Cole Run Falls

  • 3
  • 2
  • 113

Forum statistics

Threads
198,958
Messages
2,783,784
Members
99,758
Latest member
Ryanearlek
Recent bookmarks
0
OP
OP
Stephen Benskin
Joined
Jan 7, 2005
Messages
2,615
Location
Los Angeles
Format
4x5 Format
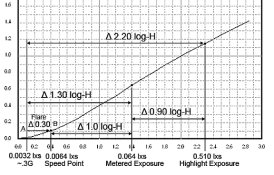
Now that we know our target exposures for the speed point and metered exposure point, let's see how we can use them to evaluate a film testing procedure. I'd like to use the Schaffer method of contacting a step tablet with the film and using a camera to regulate the exposure. For the test exposure, the instructions are to meter a surface and open up 5 stops. For a 125 speed film, we know the metered exposure at the film plane is 0.064 lxs. Five stops over that is 2.048 lxs.

At what step tablet density would the incident exposure of 2.048 lxs (light falling on the step tablet) create a film plane exposure of 0.064 lxs (light transmitted through the step tablet)? Since the instructions were to open up 5 stops over the metered exposure and since step tablets consist of 10 stops of density, I'm going to use a the middle step which is half the total 3.0 density of the step tablet or a density of 1.50.

The equation to determine the amount of light transmitted through a unit of density is to multiply the illuminance by the reciprocal of the antilog of the step tablet density - 1/10^density * illuminance.

1/10^1.50 * 2.048 = 0.065 lxs

This validates using an exposure of 5 stops over the metered exposure for the test exposure. We know the speed point exposure is 1.0 logs below the metered exposure point or at a step density of 1.0 units higher or a step tablet density of 2.50.

1/10^2.5 * 2.048 = 0.0065 lxs

For a 125 speed film, the film density of 0.10 over Fb+f should result from the exposure at the step tablet density of 2.50. Schaffer, however, uses the step tablet density of 2.70 for the target speed point density. That is 0.20 logs or 2/3 stop difference in exposure. This indicates Schaffer’s test is using a different speed point than the ISO standard and consequently will produce different film speeds under the same conditions. What would the film speed be at 2.70?

1/10^2.70 * 2.70 = 0.0041 lxs

In order to achieve a film density of 0.10 at the step tablet density of 2.70, the film speed would have to be 195. But that is not how Schaffer describes this part of determining the EI. What he proposes is to determine the exposure difference between the density at 2.70 and where 0.10 falls and adjust the EI value accordingly. As we know that point is at a step tablet density of 2.50 or a 2/3 stop difference. For the 0.10 density to fall at the step tablet density of 2.70, the exposure of the step tablet would have to be increased by 2/3 stop which would indicate the film EI to be 2/3 stop slower than the 125 speed film that it is. This method would produce EIs in line with the typical EIs from Zone System testing methods which consistently result in speeds ½ to 1 stop slower than the ISO film speed.

Whether or not Schaffer’s testing method produces more favorable film speeds is up to the individual. What we now know is that the method uses testing parameters that are different than the ISO method and close to the parameters and results obtain with Zone System testing. In my opinion, I would find this analysis valuable when choosing a testing methodology.
 
Last edited by a moderator:

Bill Burk

Subscriber
Joined
Feb 9, 2010
Messages
9,316
Format
4x5 Format
Your analysis makes sense, and if I were to use his method I might be tempted to fix the two-step discrepancy.
 
OP
OP
Stephen Benskin
Joined
Jan 7, 2005
Messages
2,615
Location
Los Angeles
Format
4x5 Format
Your analysis makes sense, and if I were to use his method I might be tempted to fix the two-step discrepancy.


And you'd have no idea without the use of the exposure values and the metered exposure to speed point ratio.
 
Last edited by a moderator:
Bill Burk

Subscriber
Joined
Feb 9, 2010
Messages
9,316
Format
4x5 Format
consider the convenience of a density 0.10 over Fb+f for a speed point. Wouldn't that be a lot easier to find than something based on some fraction of the gradient?

Yes, and the rationale (that 0.1 is easy to find) was pointed out as they made 0.1 the standard. With computers, you'd think 0.3 gradient would be easy to find and possibly promoted as a better speed measure. But I haven't found it easy to fit curves with spreadsheet programs.
 
OP
OP
Stephen Benskin
Joined
Jan 7, 2005
Messages
2,615
Location
Los Angeles
Format
4x5 Format
The best part was how simple the math was.

That was for sensitometric exposure. Camera exposure is a touch more complex. Actually the hardest part for me keeping track of the correct terms (and conversion) for the units of measurement, especially for luminance.
 
Last edited by a moderator:
Bill Burk

Subscriber
Joined
Feb 9, 2010
Messages
9,316
Format
4x5 Format
So now we have this meter point ten times the speed point for black and white negative film.

But we really consider the normal subject range to be what, 7 1/3 stop?

Where do we expect the normal subject to fall in relation to the metered point? How much above and how much below? Is the meter smack in the middle?

Haa, I'm not teasing like I know the answer and am quizzing. I know these threads are easier to follow as a storyline playing out... but I don't know and so will have to sketch it out to see if I can figure. Does the bottom of the 7 1/3 stop average range equal the speed point. I don't think so but don't know for sure. I think the speed point only equals the bottom of the Normal range for Zone System.
 
OP
OP
Stephen Benskin
Joined
Jan 7, 2005
Messages
2,615
Location
Los Angeles
Format
4x5 Format
So now we have this meter point ten times the speed point for black and white negative film.

But we really consider the normal subject range to be what, 7 1/3 stop?

Where do we expect the normal subject to fall in relation to the metered point? How much above and how much below? Is the meter smack in the middle?

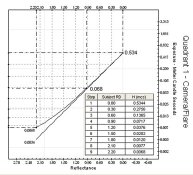
This is about the relationship between the subject luminance range, camera exposure, and sensitometric exposure. I'm working on something that will support my answer to your question. The range above the metered exposure point is approximately 0.92 logs and the range below is 1.28 logs (not including flare).

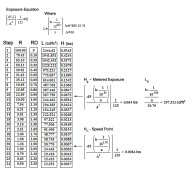
It works something like in this example. The ranges have been rounded to simplify the example. Note where Hm falls compared to the shadow exposure and remember this is the exposure for a 125 speed film - Hm = 0.0064 lxs Hg = 0.064 lxs.

125 speed exposure points.jpg

For reference, here are the sensitometric exposures for a 0.00 to 3.0 density step tablet exposed at 2.048 lxs.

Sensitometric exposure for 125 speed.jpg
 
Last edited by a moderator:
Bill Burk

Subscriber
Joined
Feb 9, 2010
Messages
9,316
Format
4x5 Format
This is about the relationship between the subject luminance range, camera exposure, and sensitometric exposure. I'm working on something that will support my answer to your question. The range above the metered exposure point is approximately 0.92 logs and the range below is 1.28 logs (not including flare).

It works something like in this example. The ranges have been rounded to simplify the example. Note where Hm falls compared to the shadow exposure and remember this is the exposure for a 125 speed film - Hm = 0.0064 lxs Hg = 0.064 lxs.

View attachment 68594

For reference, here are the sensitometric exposures for a 0.00 to 3.0 density step tablet exposed at 2.048 lxs.

View attachment 68595

I see the bottom is practically zero. So adding "about a stop" for flare would bring the bottom of the "standard subject range" about to 0.10 density. Not that the low end of the range "hits" the speed point, but that flare effectively makes your film have the density associated to the speed point.
 
OP
OP
Stephen Benskin
Joined
Jan 7, 2005
Messages
2,615
Location
Los Angeles
Format
4x5 Format
I see the bottom is practically zero.

At the approximate fractional gradient point actually. Think about it. What is ΔX for the contrast parameters outlined in the ISO film speed standard? 0.29 logs. Hm is Δ1.0 logs from the metered exposure point. And the average log-H range below the metered exposure point is Δ1.28 log-H. 1.28 - 1.00 = 0.28 logs. This is not a coincidence.
 
Last edited by a moderator:
OP
OP
Stephen Benskin
Joined
Jan 7, 2005
Messages
2,615
Location
Los Angeles
Format
4x5 Format
The film’s characteristic curve is a representation of how the film responds to a range of sensitometric exposures under specific processing conditions. It’s a picture of the film. I like to think of camera exposure as being superimposed on the film curve, and while the camera exposure can move around the curve, the film curve itself doesn’t change. This approach helps me distinguish between the sensitometric exposure and the camera exposure.

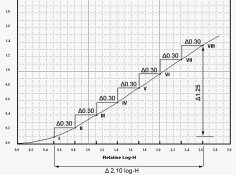
There are a couple of ways to think about how the camera exposure falls on the characteristic curve. One is to have an exposure range that has one of it’s points falling on a target density like in the first example.

FIlm Curve 30 intervals.jpg

Another way is to use the actual log-H values determined from the sensitometric exposure and link them to the actual camera exposure. While this method isn’t practical for most people, I believe it can be useful just to understand how it works.

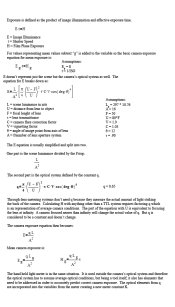
First we start with the classic camera exposure equation. This isn’t any different than the H = E * t equation except that value for E comes from it’s own equation. The explanation is an excerpt from a K-factor thread.

exposure equation.jpg

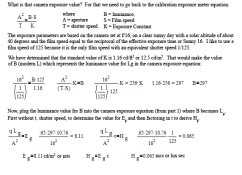
Lg can be determined using the exposure meter calibration equation. Please note the value of Eg is 8.11. Rounded this becomes 8 which is the exposure constant usually referred to as “P”. This is the same constant that has the 10X ratio with the film speed constant of 0.8.

Hg value.jpg
 
Last edited by a moderator:
OP
OP
Stephen Benskin
Joined
Jan 7, 2005
Messages
2,615
Location
Los Angeles
Format
4x5 Format
With the exposure formula in hand, we can now work out the range of film plane exposures (H) for the average scene luminance range. The range is measured from a diffused white containing some semi-specular highlights which has a reflectance of 100%. The range is 2.20 logs.

Exposure Equation 05.12.jpg

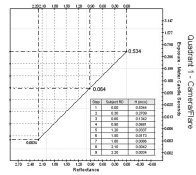
The aim exposure at Hg for a 125 speed film falls at a reflectance of 12%. The value of L define in the exposure meter standard confirms this exposure (the numbers are slightly off here probably because of rounding). An exposure at Δ1.0 logs below Hg equals the aim value of Hm = 0.0064 lxs for a 125 speed film. The shadow exposure falls approximately Δ0.30 logs below Hm.

This can be plotted.

Plotting exposure 2.jpg
 
Last edited by a moderator:
OP
OP
Stephen Benskin
Joined
Jan 7, 2005
Messages
2,615
Location
Los Angeles
Format
4x5 Format
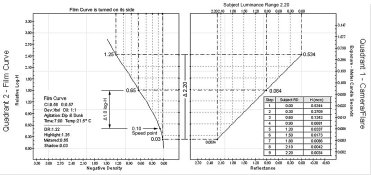
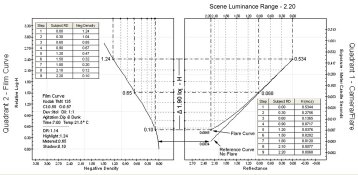
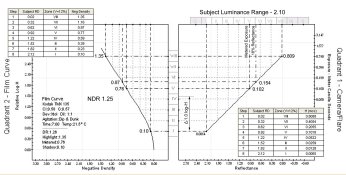
Now we can combine the camera exposure with the film curve by aligning the camera exposures up with the sensitometric exposures. For this to work, the camera, the film curve is turned on it’s side. This can be disorienting at first, but it will soon become second nature.

2 Quad - Exposure example.jpg

For a film that has a speed of 125, the exposure of 0.0064 lxs falls on the 0.10 density speed point and 0.064 lxs falls Δ1.0 log-H above it. This is how the subject luminance range is connected to the film curve using just the film speed number and an exposure meter that wants to place everything at 8 lux, except there’s a problem with this example.

Upon a closer look, the shadow exposure doesn’t line up with the speed point. It has an exposure of 0.0034 lxs or almost a full stop less than the exposure needed to reach the speed point. Where the exposure of 0.0064 occurs, it does line up with the speed point, but it represents the shadow luminance at RD 1.92 and not the deepest shadowed measured at RD 2.20. What's wrong?
 

Bill Burk

Subscriber
Joined
Feb 9, 2010
Messages
9,316
Format
4x5 Format
You don't have the flare in the camera/flare quadrant yet.

Though our normal subject has 2.20 range, the deepest shadows can't make it to the film as such deep shadows through the optics of the camera. There is a bit of light pollution, flare, that brings the lowest shadow up. (To the speed point? I don't know but it lifts it up.)
 

Bill Burk

Subscriber
Joined
Feb 9, 2010
Messages
9,316
Format
4x5 Format
OK but flare is like light pollution for astronomers, it will keep you from ever being able to see the blackest black of the subject. I am guessing that flare was factored into the selected metered point.
 
OP
OP
Stephen Benskin
Joined
Jan 7, 2005
Messages
2,615
Location
Los Angeles
Format
4x5 Format
OK but flare is like light pollution for astronomers, it will keep you from ever being able to see the blackest black of the subject. I am guessing that flare was factored into the selected metered point.

Flare wasn't factored into that example. I wanted to show where the exposures fall in a no flare situation, that represents the same results as contacting, to illustrate how the shadows won't fall around the speed point if flare isn't incorporated. So, the next step is to add flare to the exposure equation.
 
Last edited by a moderator:
OP
OP
Stephen Benskin
Joined
Jan 7, 2005
Messages
2,615
Location
Los Angeles
Format
4x5 Format
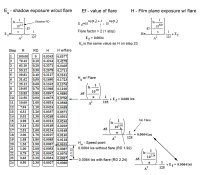
There are a few steps to determining the value of flare. The first step is to find the exposure for the shadow. This equation is the first equation in the upper left of the example. The example uses a subject luminance range of 2.20 logs with the diffused highlight starting at 100% reflectance. That means the shadow RD is 2.20. The next step is to determine the flare value. I’m using a flare factor of 2 or 1 stop. A one stop flare factor value of flare will equal the value of the shadow exposure. This value is then added to each calculated value of exposure.

In the example, the actual nomenclature for Es and Ef should be Hs and Hf. I wanted to use separate symbols for the flare exposure in order to an attempt to minimize confusion.

Exposure Equation example w flare.jpg

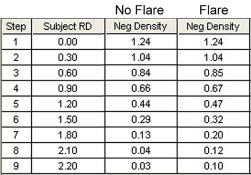
Flare has effectively doubled the shadow exposure at RD 2.20. It has gone from 0.0034 lxs to 0.0068 lxs with the addition of flare. This brings the shadow exposure up to the exposure for Hm. Without flare 0.0064 lxs would occur at an RD of 1.92 which is a touch under one stop difference.

How does this look plotted?

Plottiing Example with flare.jpg

Matched to the film curve.

2 Quad - Exposure example w flare.jpg

And comparing the resulting negative densities from the no flare and flare examples.

Negative Density Comparison.jpg
 
Last edited by a moderator:
OP
OP
Stephen Benskin
Joined
Jan 7, 2005
Messages
2,615
Location
Los Angeles
Format
4x5 Format
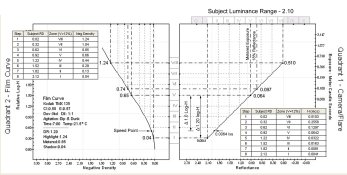
Let’s look at an exposure example relating the numerical values for exposure with Zone System designations. Because the Zone System keys the luminance range to the exposure meter, the highlight luminance is a touch less than 100% reflectance. In fact, every reference point is shifted by a RD of 0.02. Not that this is a big deal, it just makes comparison between the two example more difficult. I’ve added a 18% reflectance guideline.

Because this is a no flare model, the exposures will be identical to sensitometric exposures. In camera Zone System testing, while using an optical system, produces minimal to effectively zero measurable flare. So, this example can be thought of as a close representation of Zone System in camera testing.

2 Quad - Exposure example - Zone 1.jpg

We can see that the metered exposure is correct for a 125 speed film, and 1.0 logs below is the speed point and the exposure there will produce a film speed of 125. Like with the 2.20 luminance range example, the shadow exposure falls below the speed point.

From the flare example, we know that the shadow will be brought up to around the speed point under normal shooting conditions, but this isn't factored in with in camera Zone System testing. The idea with ZS testing is to align the exposure Δ 1.20 logs below the metered exposure point with the speed point which is Δ 1.0 logs below the metered exposure. This usually means increasing the camera exposure (under rating the film).

The next example shows an exposure increase of 2/3 stop. This brings the shadow exposure up to the speed point. It also raises up the metered exposure and where it will fall. Instead of being at 0.064 lxs, it is at 0.102 lxs. This means the EI setting on the camera for a 125 speed film will be at 8 / 0.102 or EI 78 (80). If some experimental error exists, the EI could easily be 64 or half the film speed.

2 Quad - Exposure example - Zone 2.jpg

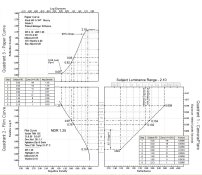
Notice how the negative density range in the adjusted exposure example is at the traditional Zone System 1.25. This is what one would expect from a sensitometrically exposed 2.10 exposure range, but not from a 2.10 subject luminance range shot through an optical system incorporating flare. One way to tell the target 1.25 negative density range isn’t appropriate is to check to see how it fits with the photographic paper.

3 Quad - Exposure example - Zone System.jpg

The paper LER that is considered to be in the middle of the range for grade 2 paper printed with a diffusion enlarger is 1.05. The LER is determined between the points 0.04 over Pb+f and 90% of the paper Dmax. Clearly the 1.25 negative density range doesn’t fit a grade 2 paper. But many Zone System practitioners swear that they use something close to 1.25 for their testing range and their negatives fit well on a grade two paper. The reason for this is the 1.25 negative density range comes from a no flare test and the prints are from negatives made in a camera with flare which reduces the negative density range.
 
Last edited by a moderator:

Bill Burk

Subscriber
Joined
Feb 9, 2010
Messages
9,316
Format
4x5 Format
The paper LER that is considered to be in the middle of the range for grade 2 paper printed with a diffusion enlarger is 1.05. The LER is determined between the points 0.04 over Pb+f and 90% of the paper Dmax. Clearly the 1.25 negative density range doesn’t fit a grade 2 paper. But many Zone System practitioners swear that they use something close to 1.25 for their testing range and their negatives fit well on a grade two paper. The reason for this is the 1.25 negative density range comes from a no flare test and the prints are from negatives made in a camera with flare which reduces the negative density range.

1.05 is my aim. I don't quite understand where the traditional 1.25 came from but I have heard many practitioners choose that. Your explanation makes sense.
 
OP
OP
Stephen Benskin
Joined
Jan 7, 2005
Messages
2,615
Location
Los Angeles
Format
4x5 Format
1.05 is my aim. I don't quite understand where the traditional 1.25 came from but I have heard many practitioners choose that. Your explanation makes sense.

Adams, The Negative, page 220.

Good to know someone is following this.
 
Last edited by a moderator:
Photrio.com contains affiliate links to products. We may receive a commission for purchases made through these links.
To read our full affiliate disclosure statement please click Here.

PHOTRIO PARTNERS EQUALLY FUNDING OUR COMMUNITY:


Ilford ADOX Freestyle Photographic Stearman Press Weldon Color Lab Blue Moon Camera & Machine
Top Bottom