Progress on XTOL-concentrate

Mansion

A
Mansion

  • 0
  • 0
  • 0
Lake

A
Lake

  • 0
  • 0
  • 0
One cloud, four windmills

D
One cloud, four windmills

  • 0
  • 0
  • 7
Priorities #2

D
Priorities #2

  • 0
  • 0
  • 6
Priorities

D
Priorities

  • 0
  • 0
  • 7

Forum statistics

Threads
199,015
Messages
2,784,648
Members
99,772
Latest member
samiams
Recent bookmarks
0
OP
OP

albada

Subscriber
Joined
Apr 10, 2008
Messages
2,175
Location
Escondido, C
Format
35mm RF
Mark; I would suspect underdevelopment until proven otherwise. PE

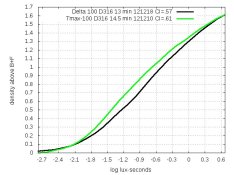
I dev'd a roll today in D316 for 15.5 minutes (the prior was 14). The leader-densities are:

XTOL: 2.28
D316 14m: 2.11
D316 15.5m: 2.41

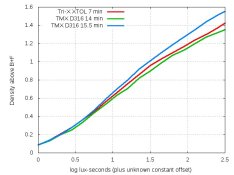
Here are the curves for both of those and XTOL:

CurveTMX-2xD316-XTOL.jpg

Do you think it's possible to match XTOL's curve? If not, imagine a curve halfway between those two corresponding to about 14.75 minutes. It's not what XTOL would produce, but would be similar to Tri-X. Maybe that would be acceptable?

Mark Overton
 

Gerald C Koch

Member
Joined
Jul 12, 2010
Messages
8,131
Location
Southern USA
Format
Multi Format
Mark,

In order for the graphs to be really meaningful and to draw conclusions there nust be at least three seperate measurements for each data point. This means 3 trials for each developer noted on a graph. Then the various points can be shown with error bars. It is only after this that one can be confident of the relative placement among the curves. It is possible that the curves for Xtol and your developer to fall within each others confidence limits.

The following site may be helpful www.pafaculty.net/biology/keith/KR_Graph_site/Deviation.html. It's a lot of work but necessary.

Jerry
 
Last edited by a moderator:
OP
OP

albada

Subscriber
Joined
Apr 10, 2008
Messages
2,175
Location
Escondido, C
Format
35mm RF
I doubt if you can match XTOL, but the results look interesting. Thanks. PE

A surprise: D316 (at the shorter dev-time) is delivering finer grain than XTOL in the shadow- and midtone-portions of the curve where it matches XTOL's curve. In fact, even the overdeveloped D316 roll matches XTOL's grain (judged by 22x loupes). The curve's shape looks like Tri-X. Here are the two TMX/D316 curves with the Tri-X/XTOL curve (in red) for comparison:

t.jpg

I think I'll boost dev-time of the green curve a little (to 14.5 min) to match the curve of Tri-X, and say, "If it's good enough for Kodak, it's good enough for me." :smile: And grain should still be finer.

PE: I appreciate all the help you provide. Thanks!

Mark
 
OP
OP

albada

Subscriber
Joined
Apr 10, 2008
Messages
2,175
Location
Escondido, C
Format
35mm RF
Mark,

In order for the graphs to be really meaningful and to draw conclusions there nust be at least three seperate measurements for each data point. This means 3 trials for each developer noted on a graph. Then the various points can be shown with error bars. It is only after this that one can be confident of the relative placement among the curves. It is possible that the curves for Xtol and your developer to fall within each others confidence limits.

The following site may be helpful www.pafaculty.net/biology/keith/KR_Graph_site/Deviation.html. It's a lot of work but necessary.

Jerry

That's the advantage a corporation has: They can have engineers and testers work full-time on a project. Those of us doing this as a hobby in evenings/weekends take short-cuts. My short-cut has been to develop just once, and if all looks normal, accept that and proceed to the next test. Also, I have tight control over temperature, exposure, agitation, etc. to try to improve the chance that my first try will not have any anomalies. But your point is that there is still test-to-test variation, and only multiple tests will reveal the variation-ranges.

Do you have any ideas of how to get variation-ranges (error-bands) without tripling the amount of effort? Maybe if I make three runs of the most popular films, and just one of the others? Or three runs of anything that looks odd? Or maybe others could volunteer to share the tedious testing effort?

Mark
 

Gerald C Koch

Member
Joined
Jul 12, 2010
Messages
8,131
Location
Southern USA
Format
Multi Format
The problem with doing only obly one run for each film is that you can't determine what error limits there are. Statistically they can be very high. In an analysis there are two factors; accuracy and reproducibility. You can have a set of values that have a very high degree of reproducibility but are yet far from the real value. Conversely you can have a set of values with little evidence of reproducibility whose average is very close to the real value. Without doing a statistical analysis any data is suspect. Your analysis is better when you include Xtol since it can be said to be a standard and validates your method. At a very bare minimum you need two sets of data. A spreadsheet can take away the drudgery of the mathematics. I personally would stick to tier one films since their quality control removes another variable.

Jerry
 

Rudeofus

Member
Joined
Aug 13, 2009
Messages
5,081
Location
EU
Format
Medium Format
From reading previous postings, Mark had excellent reproducibility even when he redid tests on different days, so most likely the error bars will be much smaller than you think. It is cheap and easy to ask for multiple test runs, but expensive and tedious to actually do them.

With that in mind, I would recommend he repeats tests where he measures anomalies in order to make sure that we don't try to solve a mystery which turns out a measurement artifact. Such a repeat test could also tell us whether the anomaly is consistent or random.
 
OP
OP

albada

Subscriber
Joined
Apr 10, 2008
Messages
2,175
Location
Escondido, C
Format
35mm RF
My testing has revealed an odd phenomenon with both XTOL and D316: Large areas that are heavily exposed can develop to a greater density, and nearby thinner areas will develop to a lower density, causing an overall increase in contrast. Here's an example showing a small amount of this:

t.jpg

Notice that the slope increases slightly after X=1.5. That's where the top row of denser Stouffer wedges starts. This slope-change is not due to uneven lighting because other graphs are straight through there. Here's a more severe example with XTOL:

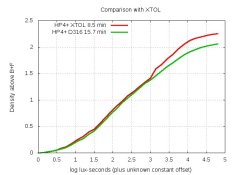
CurveFP4-D316-XTOL.jpg

This is two Stouffer graphs concatenated together at X=3.0, where the second got much more exposure. The D316 graphs match nicely, but XTOL's graphs have a big jump where density was higher. This density-boost only seems to occur where large areas have much exposure, so maybe nobody cares about it. But I'd like to avoid it in my testing. I'm thinking of shooting a roll where each frame has only a small area of a given exposure. That would eliminate this "overexposed neighbor effect" as I'll call it, and would give me 37 wedges instead of 21.

Any idea why this occurs? Is this a well known phenomenon?

Mark Overton
 
Last edited by a moderator:
OP
OP

albada

Subscriber
Joined
Apr 10, 2008
Messages
2,175
Location
Escondido, C
Format
35mm RF
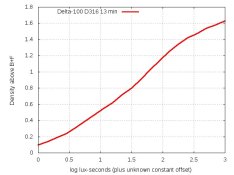
Bruce Osgood asked about Delta 100. I'm done testing it, and it works fine in D316. I suggest 13.5 minutes at 20C.

Delta 100 was interesting because, unlike all other developers I've tested, Ilford evidently did not use the ISO method of determining speed. If they had, the speed would be at least 200 and the darker shadows would be nearly black and indistinct. That's because this film has a long toe, and at the ISO speed point of 0.1 above B+F, the slope of the density-curve is still too low. I've been measuring contrasts using ISO speed points, and got odd results with Delta 100 until I figured out what was going on.

I've tested all major-brand films in production except Delta 3200 (that will be this weekend), and all work fine in D316. I'll post a long report detailing each film when I finish reviewing results and checking grain and sharpness.

Mark Overton
 
OP
OP

albada

Subscriber
Joined
Apr 10, 2008
Messages
2,175
Location
Escondido, C
Format
35mm RF
Strange, I've not found Delta 100 to have a long toe in any developer I've tested it with. In developers including D-76, XTOL and even Perceptol I've found its curve to be nearly identical to that of TMX, with Delta having only a very slightly longer "toe" (and I mean a really small difference), and slightly higher highlight contrast. If developed in DDX, Delta does slightly better on speed and toe contrast than in other developers.

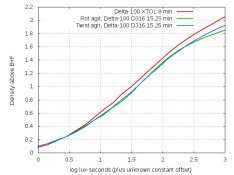
I rechecked my numbers, and indeed they say that if you use a speed point of .1 over b+f, the speed is well over 100. I interpreted that to mean a longer toe. Here are most of my Delta 100 graphs:

CurveDelta100-XTOL.jpg

XTOL is overdeveloped because I used the DigitalTruth time of 8 min instead of Ilford's 7.5 min.

A side-topic: The two curves for D316 were exposed and developed identically in all respects, including agitation-times of 10 sec each minute. However, I used vigorous agitation for the blue graph and gentle for the green. The vigorous agitation pulled up the shoulder, and had no other effect on the curve. As somebody said, "agitate for the highlights".

Mark Overton
 

Photo Engineer

Subscriber
Joined
Apr 19, 2005
Messages
29,018
Location
Rochester, NY
Format
Multi Format
Mark;

If you slide those curves around a bit, you find that the Xtol causes higher speed and sharper toe. Your developer is softer in the toe then and has low Dmax.

PE
 
OP
OP

albada

Subscriber
Joined
Apr 10, 2008
Messages
2,175
Location
Escondido, C
Format
35mm RF
Mark;
If you slide those curves around a bit, you find that the Xtol causes higher speed and sharper toe. Your developer is softer in the toe then and has low Dmax.
PE

X=0 represents the same exposure for all three. Why shift the curves?
Also, XTOL is overdeveloped, which gave it a bit of pushing-effect, shortening its toe.

Mark
 

Photo Engineer

Subscriber
Joined
Apr 19, 2005
Messages
29,018
Location
Rochester, NY
Format
Multi Format
Mark;

You shift curves to evaluate their absolute shape minus speed changes. We have a method to do that at EK. We plot each curve on a sheet of paper and then shift them electronically or on a light table mechanically.

PE
 

Bruce Osgood

Membership Council
Member
Joined
Sep 9, 2002
Messages
2,642
Location
Brooklyn, N.Y.
Format
Multi Format
SNIP
Delta 100 was interesting because, unlike all other developers I've tested, Ilford evidently did not use the ISO method of determining speed. If they had, the speed would be at least 200 and the darker shadows would be nearly black and indistinct. That's because this film has a long toe, and at the ISO speed point of 0.1 above B+F, the slope of the density-curve is still too low. I've been measuring contrasts using ISO speed points, and got odd results with Delta 100 until I figured out what was going on.


Mark Overton
end snip

I am not a chemist or chemical engineer, I grope my way by trial and error without the aid of sophisticated analysis machines. I have found Delta 100 to perform to my liking by rating it at 125 - 150. Using Kodak produced Xtol my development times are less than 8:00 with Jobo rolling development. I do not pre rinse. I like your findings and hope you will detail the formula's for the Concentrate and D316 in layman's form.
 
OP
OP

albada

Subscriber
Joined
Apr 10, 2008
Messages
2,175
Location
Escondido, C
Format
35mm RF
Mark;
You shift curves to evaluate their absolute shape minus speed changes. We have a method to do that at EK. We plot each curve on a sheet of paper and then shift them electronically or on a light table mechanically.
PE

I see what you mean -- you're shifting them horizontally (along X) to remove speed-differences, aligning them with toe-area or linear-area or wherever.

Since we're on the topic of evaluating density-curves, I was wondering why Kodak chose to put the right end of the "CI ruler" at 2.2. That ruler is marked 0.2 and 2.2, which gives a distance of 2.0 from the speed point. At a normal CI of 0.58, the distance of 2.0 corresponds to an X-axis distance of 1.73 using simple trig:

Xdist = 2.0*cos(arctan(0.58)) = 1.73

Converting 1.73 into stops: 1.73/0.3 = 5.75, which means that CI (at .58) assumes the scene contains 5.75 stops of luminance-range. Isn't that too low? I thought scenes contained a larger range than that, around 7 stops. It appears that CI is ignoring some of the highlights. Or did I miss something?

Mark Overton
 
OP
OP

albada

Subscriber
Joined
Apr 10, 2008
Messages
2,175
Location
Escondido, C
Format
35mm RF
You are over analyzing.
PE

@Rudeofus: Stop laughing! I can hear you laughing about that all the way over here. :smile:
I guess I do tend to over analyze. And some of you are saying, "What do you mean 'guess'"? :smile:
But that's better than the alternative. This testing is teaching me a great deal about variations in film, and how to test them. I didn't know that films varied so much. For that reason, I now realize that a developer needs to be tested with every film being made by Ilford, Kodak and Fuji. And it wouldn't hurt to include Fomapan as well.

Mark
 

Rudeofus

Member
Joined
Aug 13, 2009
Messages
5,081
Location
EU
Format
Medium Format
@Rudeofus: Stop laughing! I can hear you laughing about that all the way over here. :smile:
If you hear me laughing it's about my own film developing efforts. Your postings show clearly that processing has a big impact on pictorial results and that I should focus on my processing before I dismiss a film. And even those who do not home brew can learn a lot from this!

About shifting characteristic curves: PE, you lost me there (and as I read it you lost Mark as well). Why would one shift the curves except for comparing contrast? Shifting a curve left would hide the fact that it takes more light to create discernible density, wouldn't it?
 

john_s

Subscriber
Joined
Nov 19, 2002
Messages
2,145
Location
Melbourne, A
Format
Medium Format
While shifting could show a better correlation between two processes, I think most of us would view a loss of film speed to be a disadvantage.

As an aside, I wonder if anyone could offer an opinion on this: I'm interested in mixing up the simple formula in post 355, on the spot, and without propylene glycol. How long would it last after mixing? I'm thinking of a big day of film development, mixing the dev in the morning and going all day.

Also, since the vendor of my sodium metaborate (Vanbar in Melbourne Australia) have not been able to tell me which level of hydration it is, and since I don't own a pH meter, would good pH papers be enough to get the amount of metaborate right? I envisage mixing it assuming the least level of hydration then adding metaborate if pH is too low. I have some Microfine pH paper for the range 7.9 to 9.7.
 

Photo Engineer

Subscriber
Joined
Apr 19, 2005
Messages
29,018
Location
Rochester, NY
Format
Multi Format
Shifting curves (on 2 sheets of paper and over an illuminator) will show you many things.

1. The shift on the X axis will allow you to read the precise speed difference at mid scale, thus giving you the speed difference in Log E or stops.

2. The shift will show you absolute contrast differences, toe differences and shoulder differences.

When we ran series like this, we plotted each curve on one sheet of paper each. Then we shifted these sheets on a light table to align them in a way that would show the desired characteristic against a norm.

So, for example, Mark has stated that one sample has a softer toe than the other one, but IIRC, the opposite was true. You only see this if you line up the mid scales of those curves.

Try it, you will see what I mean.

PE
 
OP
OP

albada

Subscriber
Joined
Apr 10, 2008
Messages
2,175
Location
Escondido, C
Format
35mm RF
Shifting the curves is indeed helpful because you normalize for speed. For example I know if I rate Delta 100 at EI 64 and TMX at EI 80 and develop them both in XTOL 1+1, the curve shape is nearly identical up to the areas above zone X-XI where Delta has slightly higher highlight contrast than TMX.

Mike, here are the curves I'm getting for TMX and Delta 100:

Del100-TMX.jpg

It's true that the Contrast Index (done Kodak's way) of TMX is 0.04 higher, but I doubt that would account for this difference in curve-shapes. Also, Zonies would say these have about the same CI because they measure from Zone I to Zone IX, which goes out to X=0.3 where the curves converge. BTW, this graph is why I mentioned that Delta 100 has a longer toe. Can you post the curves you got for these? What CI are you getting? I'm wondering if your graphs are closer to my TMX or Delta 100 graphs. I'm also wondering if I seriously overdeveloped my TMX.

Mark Overton
 
OP
OP

albada

Subscriber
Joined
Apr 10, 2008
Messages
2,175
Location
Escondido, C
Format
35mm RF
Tmax-400 (TMY2) is acting weird again. It has an odd two-slope density-curve with both XTOL and D316. But all other films are behaving fine.
You might remember almost a year ago, that TMY2 was giving me thin results with both XTOL and home-brews. I discovered that presoaking improved density. That's still true (see graph below), but TMY2 is acting odd even with a presoak. Here are the curves:
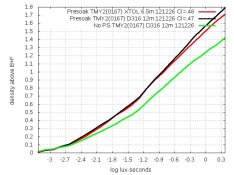
CurveTMYproblems.jpg

XTOL and D316 (with presoak) are about the same, having two slopes with an inflexion at X=-1.3, and with slightly stronger highlights in D316. But not presoaking loses much density (green curve).
Other odd symptoms include:
  • The fixer used to pour out magenta. Now it's clear.
  • The early wash-water used to pour out magenta. Now it's clear.
  • The negatives have a strong magenta cast. Even washing for 30 minutes didn't help. Even warming some wash water to just over 20C didn't help.
The batch-number of TMY2 has changed. It's now 0167; for months it's been 0166.
For comparison, here's a roll of Tri-X developed two days later. It has a perfect near-straight-line curve:
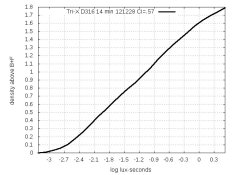
GraphTriX-D316.jpg

All other films are behaving okay also. For example, here's a roll of FP4+ developed the same day as the Tri-X:
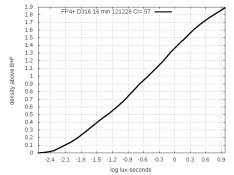
GraphFP4-D316.jpg

I'm reluctant to blame Kodak, but the batch-number has changed and suddenly these issues appeared. OTOH, it is winter, and my wash-water is cooler at 18C which could make it harder to clear the magenta dye. But that wouldn't reduce density. Or would it?

Mark Overton
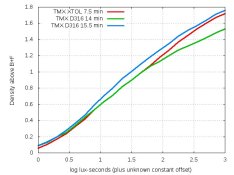
 

Photo Engineer

Subscriber
Joined
Apr 19, 2005
Messages
29,018
Location
Rochester, NY
Format
Multi Format
The "broken" curve suggests that Kodak is having trouble blending emulsions. That is usually the result of what you see in the first curve Mark.

There are those that praise such "saggy" curves. They say it gives a good tone scale to the print. I do not agree.

PE
 

Rudeofus

Member
Joined
Aug 13, 2009
Messages
5,081
Location
EU
Format
Medium Format
The "broken" curve suggests that Kodak is having trouble blending emulsions. That is usually the result of what you see in the first curve Mark.
Are these deviations between production batches something normal or would they indicate that things run a bit rough at Kodak at the moment?
 

Photo Engineer

Subscriber
Joined
Apr 19, 2005
Messages
29,018
Location
Rochester, NY
Format
Multi Format
When you are making huge batches and you are running continuously, and if you are rich enough to scrap a marginal batch, well then, things are nearly perfect. It appears as if things are not near perfect.

Of course, this assumes that Marks process and data are spot on.

PE
 
Photrio.com contains affiliate links to products. We may receive a commission for purchases made through these links.
To read our full affiliate disclosure statement please click Here.

PHOTRIO PARTNERS EQUALLY FUNDING OUR COMMUNITY:


Ilford ADOX Freestyle Photographic Stearman Press Weldon Color Lab Blue Moon Camera & Machine
Top Bottom